View the Activity Breakdown
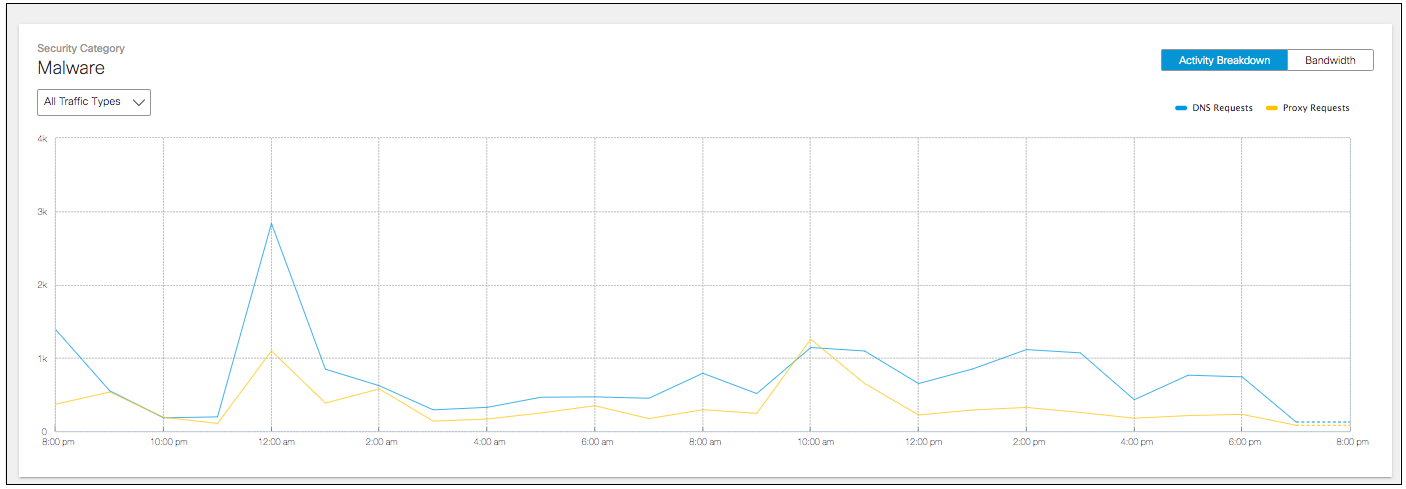
- Click a category and navigate to the traffic graph on the details page. Select Activity Breakdown.
The Activity Breakdown displays the number of DNS requests and proxy transactions for the selected time period.
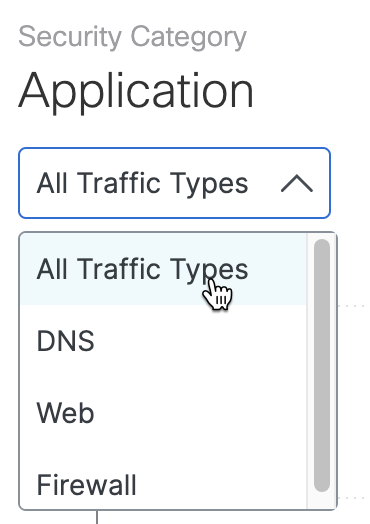
- Filter the Activity Breakdown to view All Traffic Types (default), DNS, Web, or
Firewall.
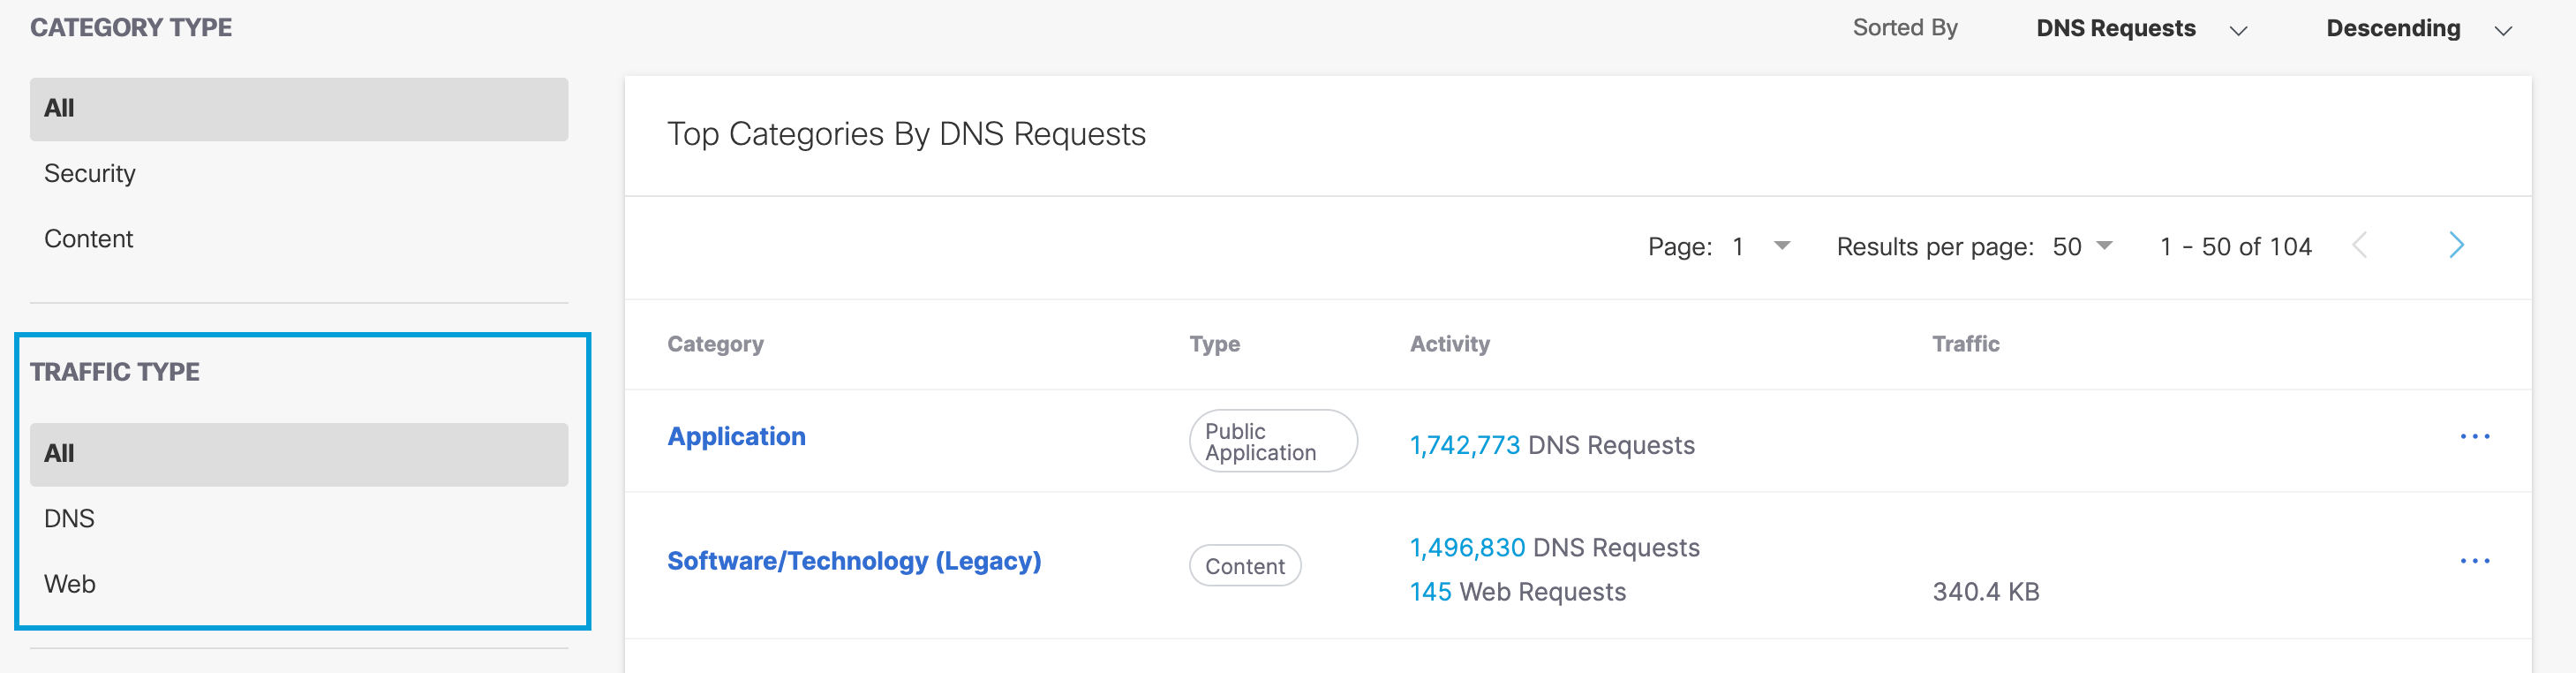
You can also choose the traffic type to filter before redirecting to the category details from the Top Category report. IP requests are not an option in Category Details.
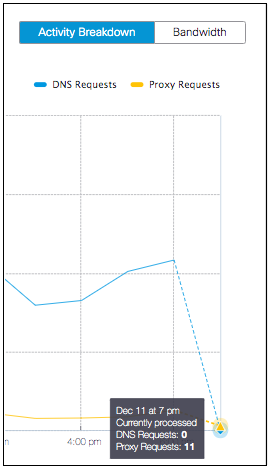
- Hover over a date and time to reveal details about the requests made at that time.
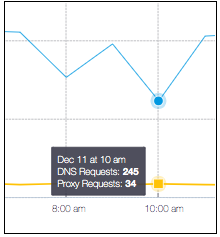
The dotted line provides available data that is still being processed. Hover over the point on the graph to see how many requests are currently processed.