Segment Visualization
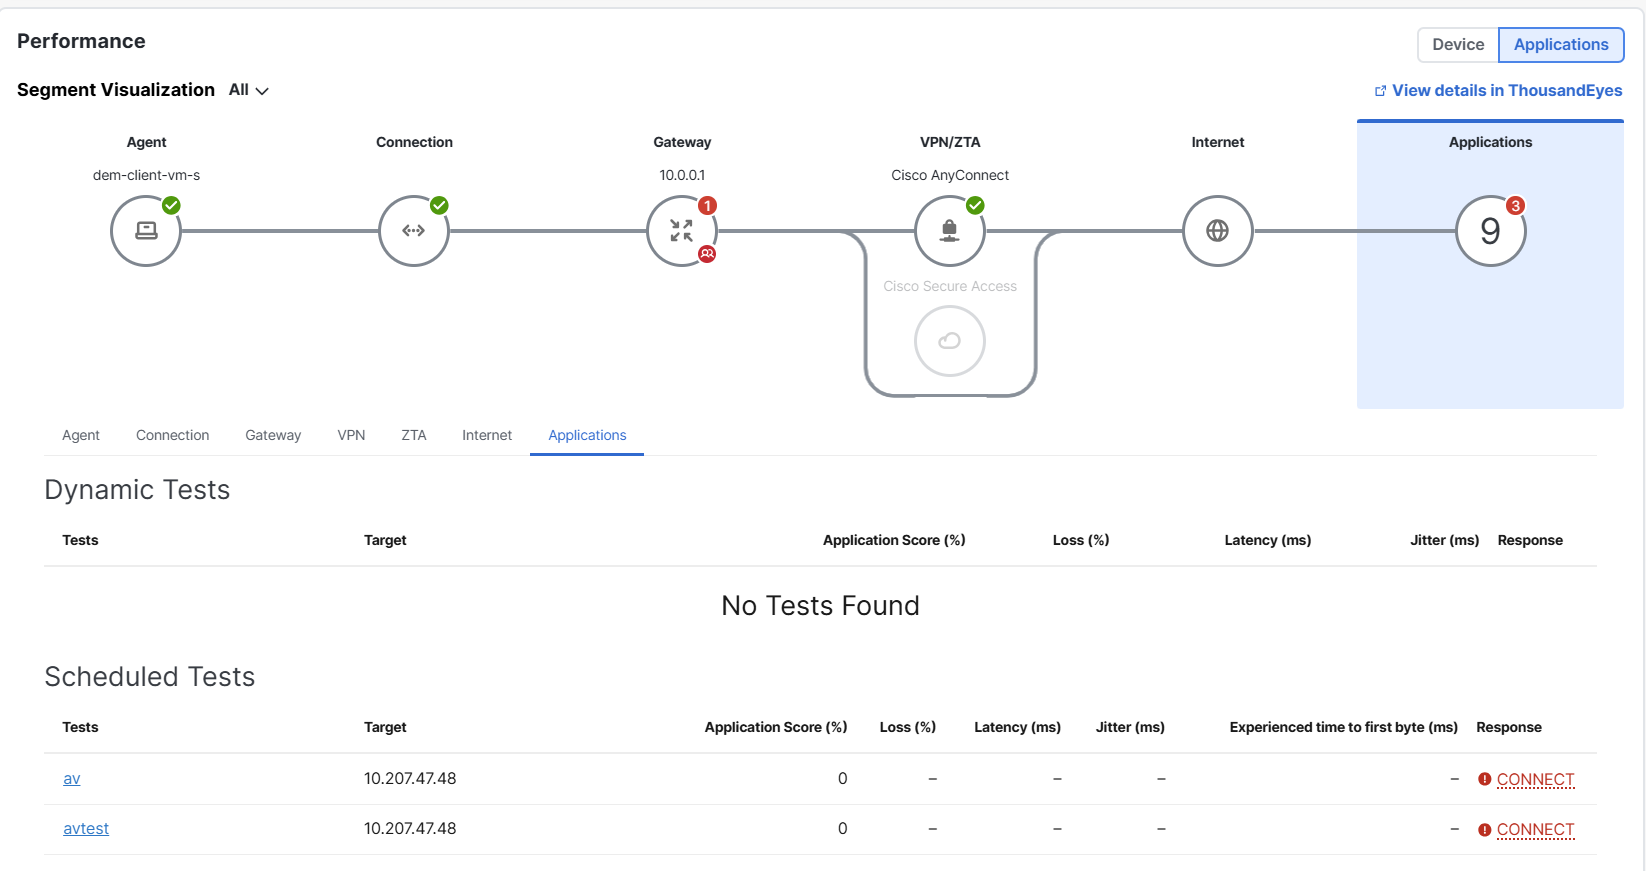
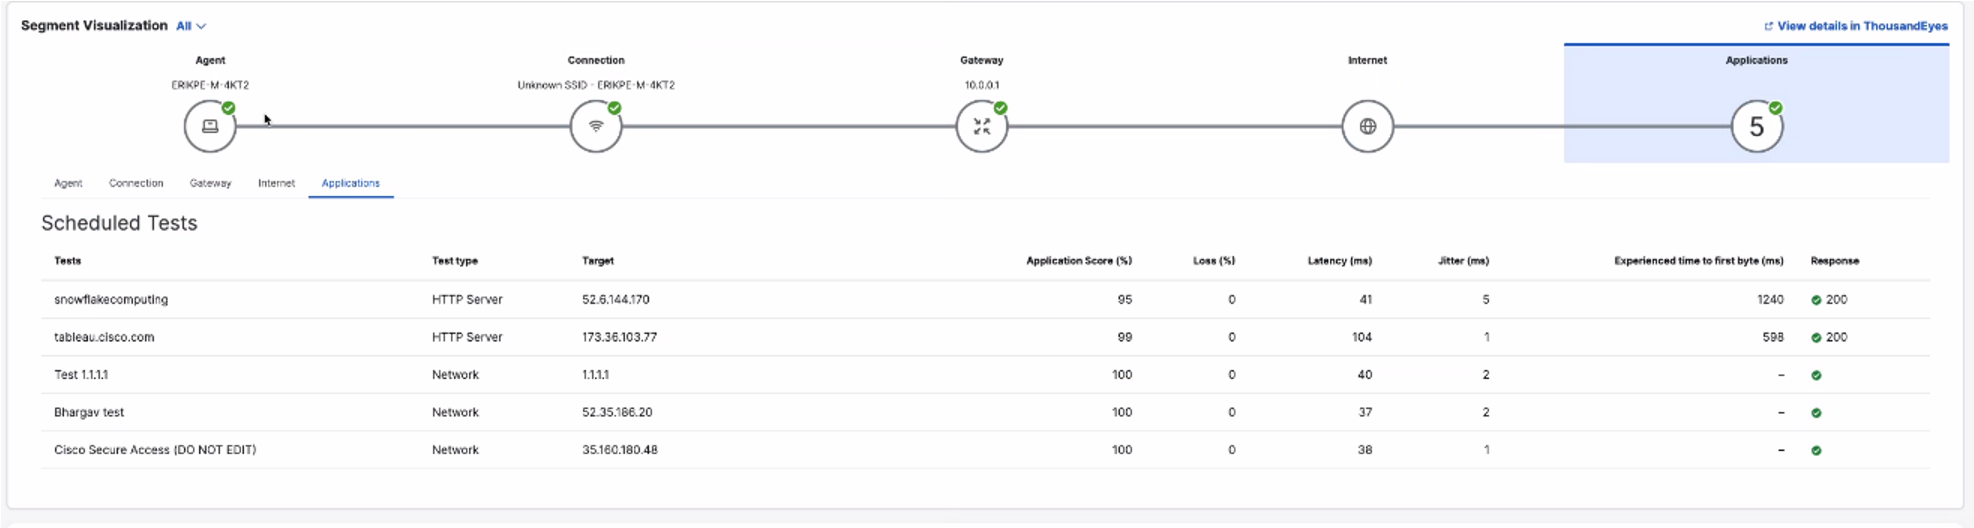
The view provides a look at the entire network journey, starting from the agent and ending at the destination, so that you can pinpoint the specific segment that is causing performance degradation. Each segment provides detailed information to troubleshoot underlying network issues.
- Your ThousandEyes license allows for one scheduled test and one dynamic test. Upgrading your license allows for additional tests. For more information about ThousandEyes licenses, see About Endpoint Agent Tests.
By default, the view covers all tests running on the agent. To filter results by test, use the drop-down menu in the top left corner.
To display the view, click the Applications button.
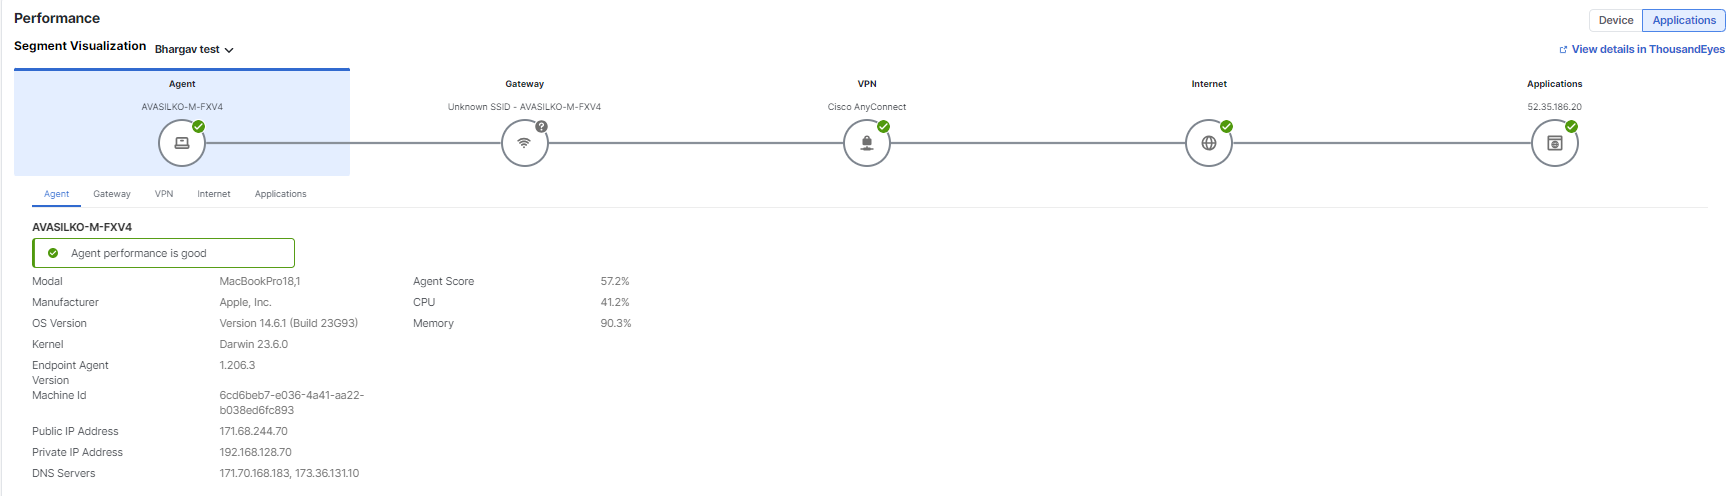
Segment details
-
Agent—Score is calculated using CPU and memory.
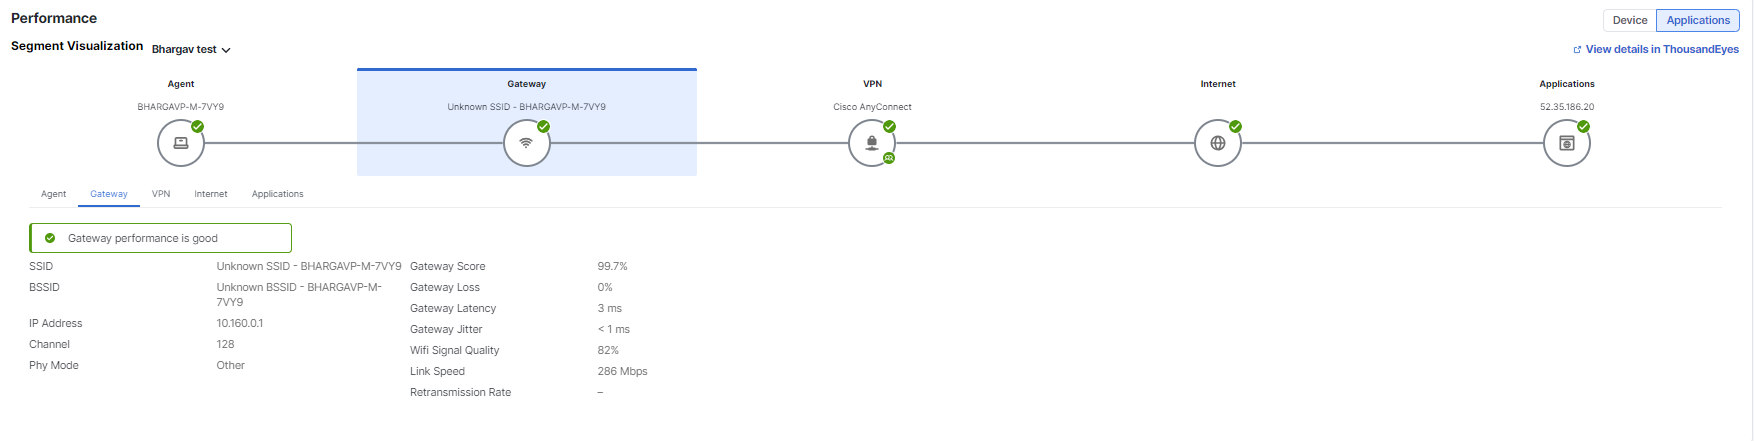
-
Gateway—Score is derived from local network tests to the gateway based on loss, latency, and jitter values.
-
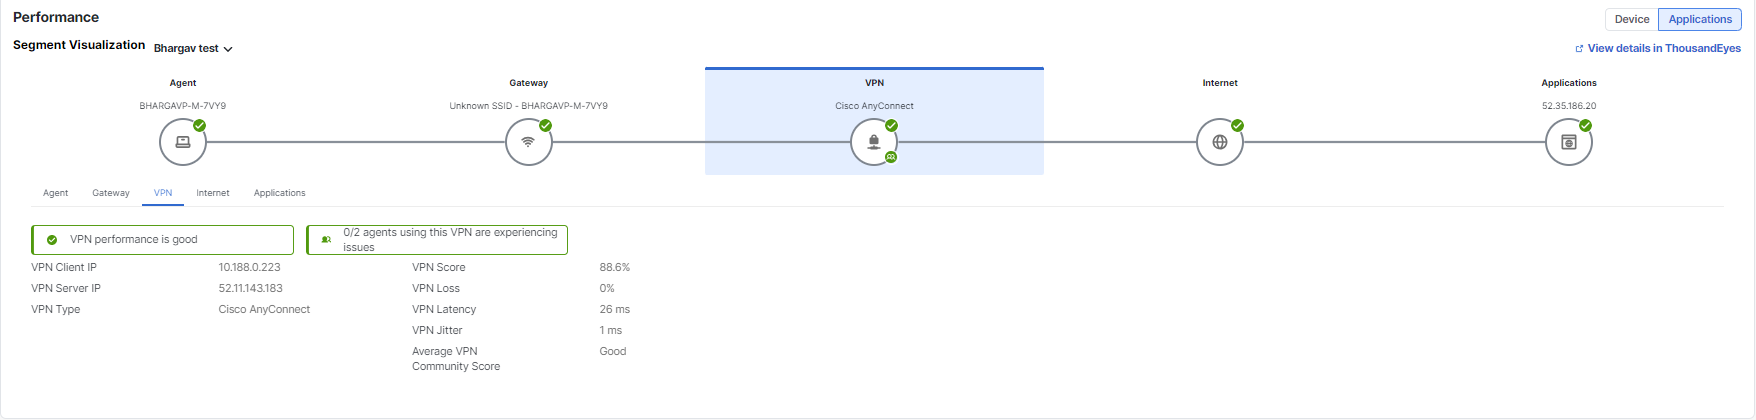
VPN—Score is derived from the local network tests of the VPN that are computed using network metrics including loss, latency, and jitter.
-
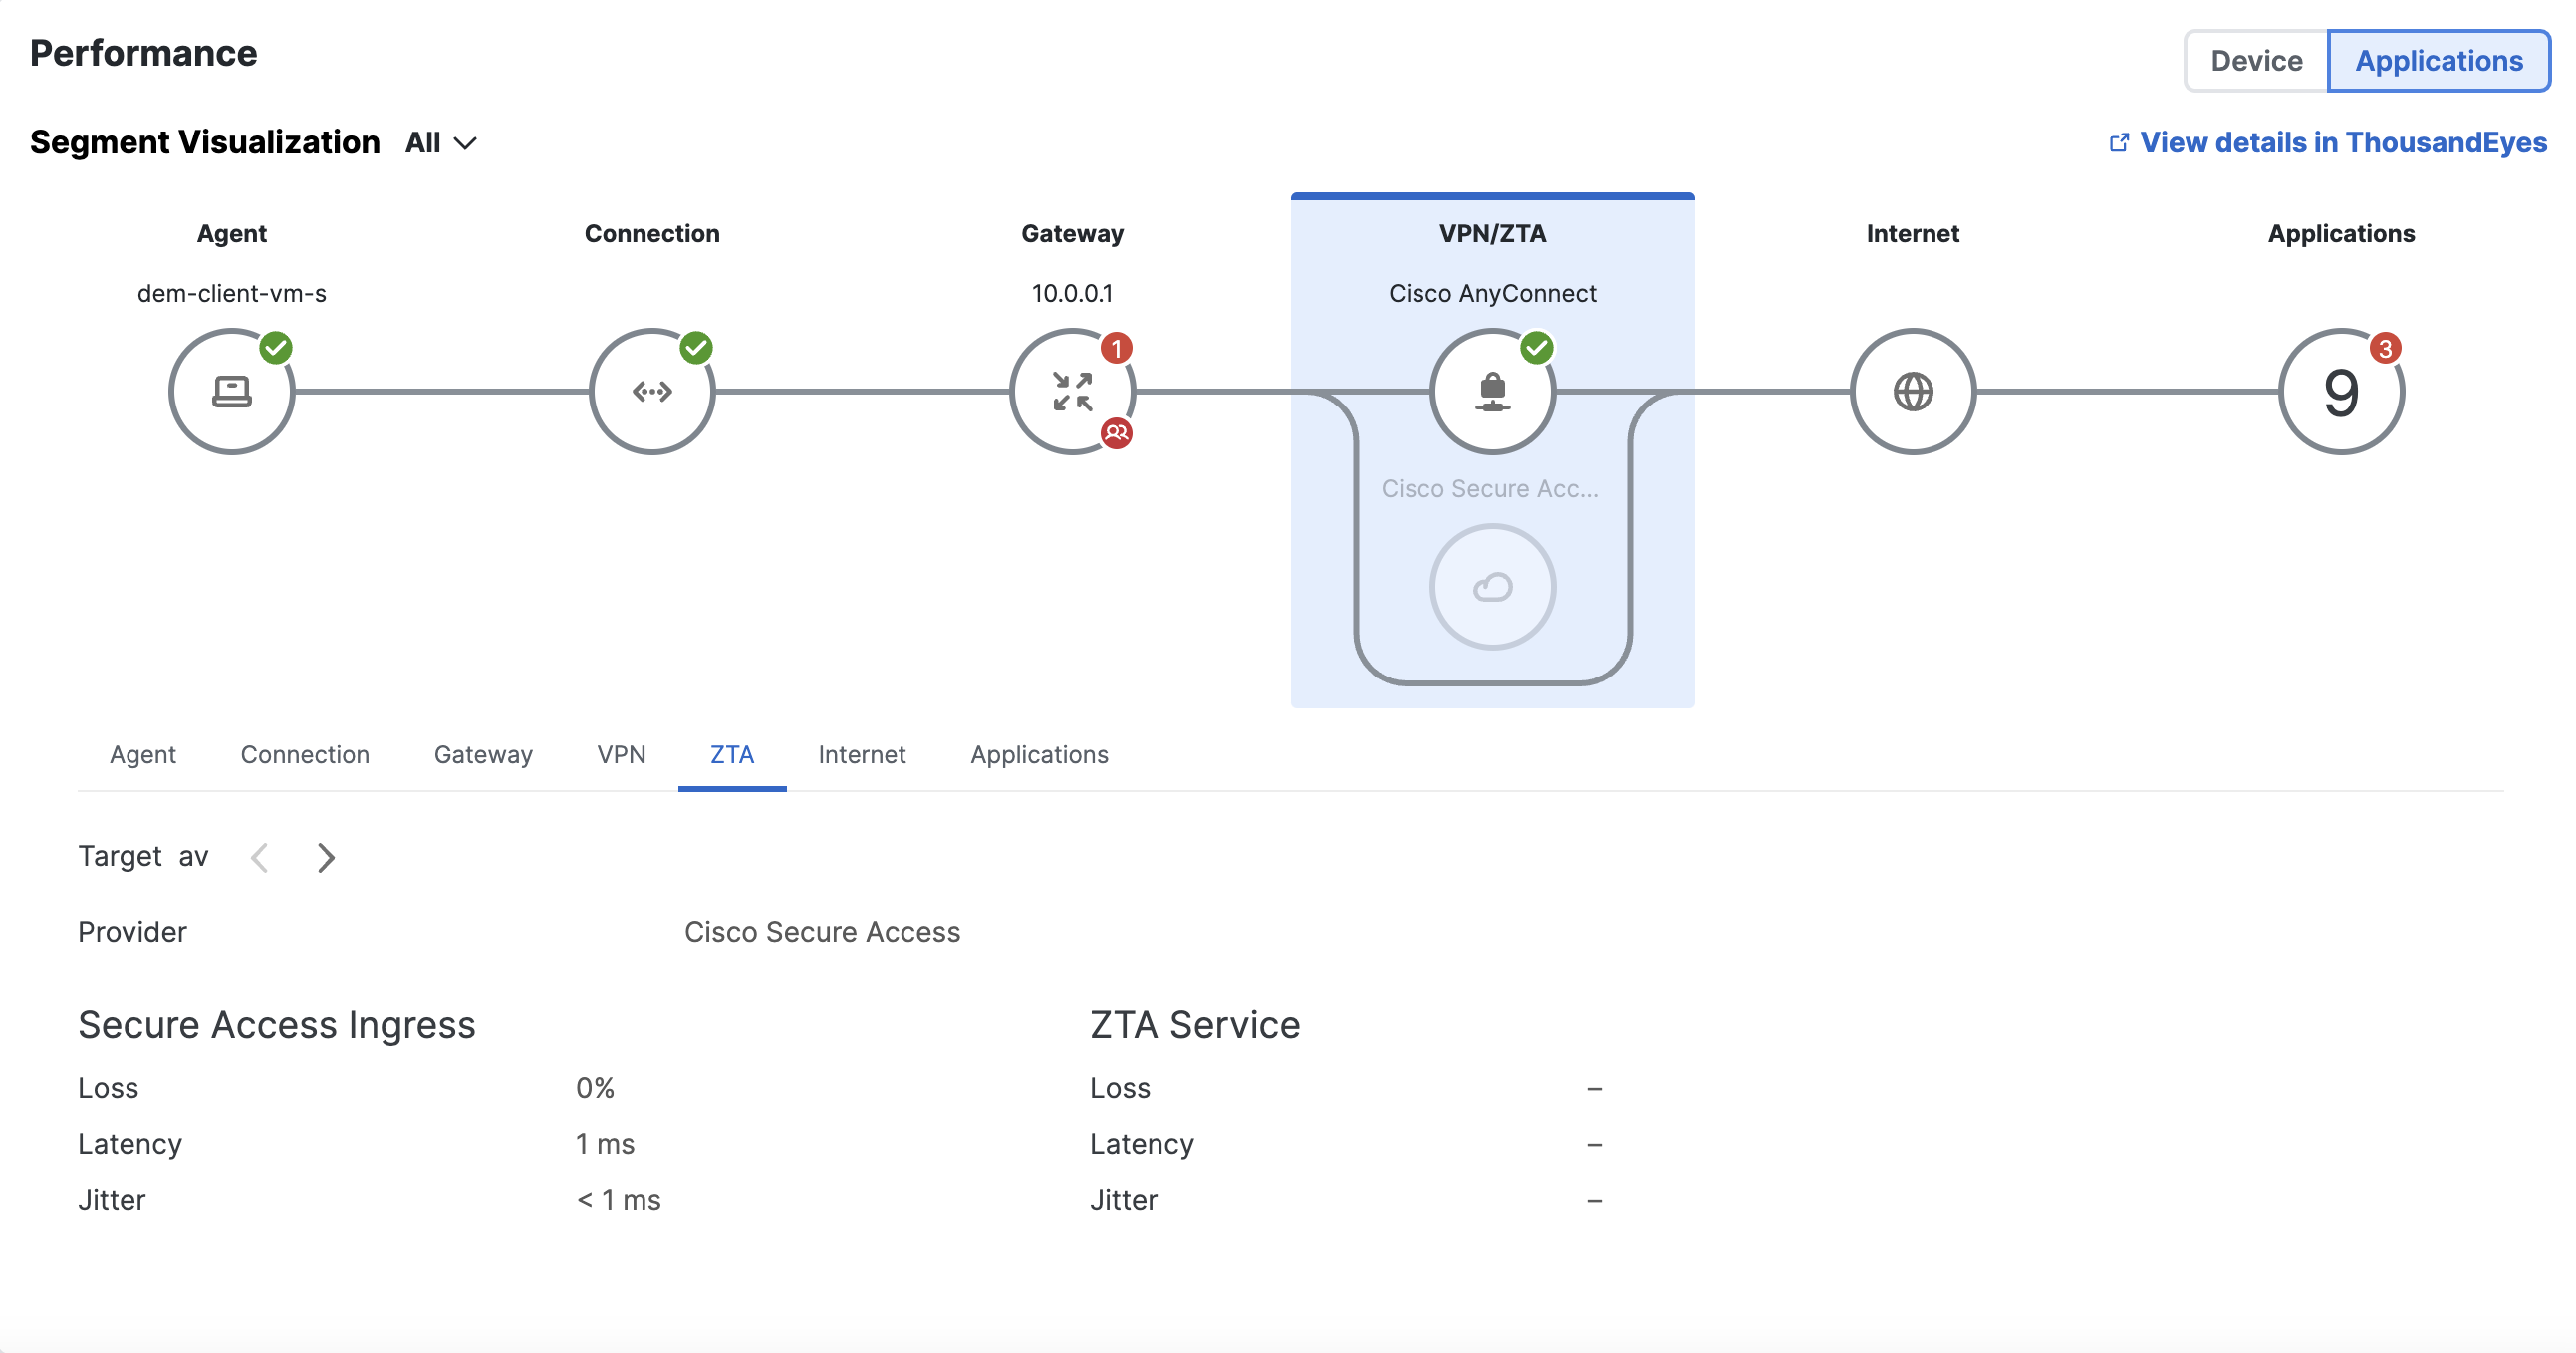
ZTA—Shows performance metrics (loss, latency and jitter) to the Secure Access ingress, which represents the unencrypted path over the internet from the client to the ZTA proxy load balancer. Also view performance metrics to the ZTA service, which represents the encrypted path towards the service.
-
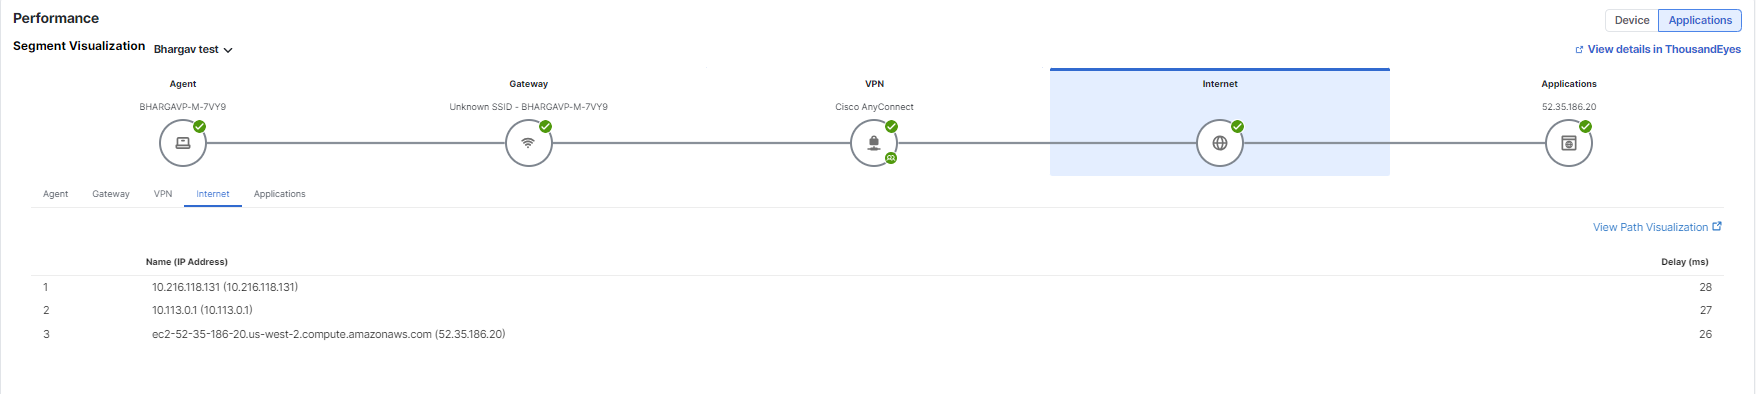
Internet—Shows the IP addresses that the device data passes through and the delay (similar to how traceroute works).
-
Application—Score reflects the overall performance of the scheduled or dynamic test that is running for an application. Calculated using loss, latency, jitter, and overall HTTP availability and response time.