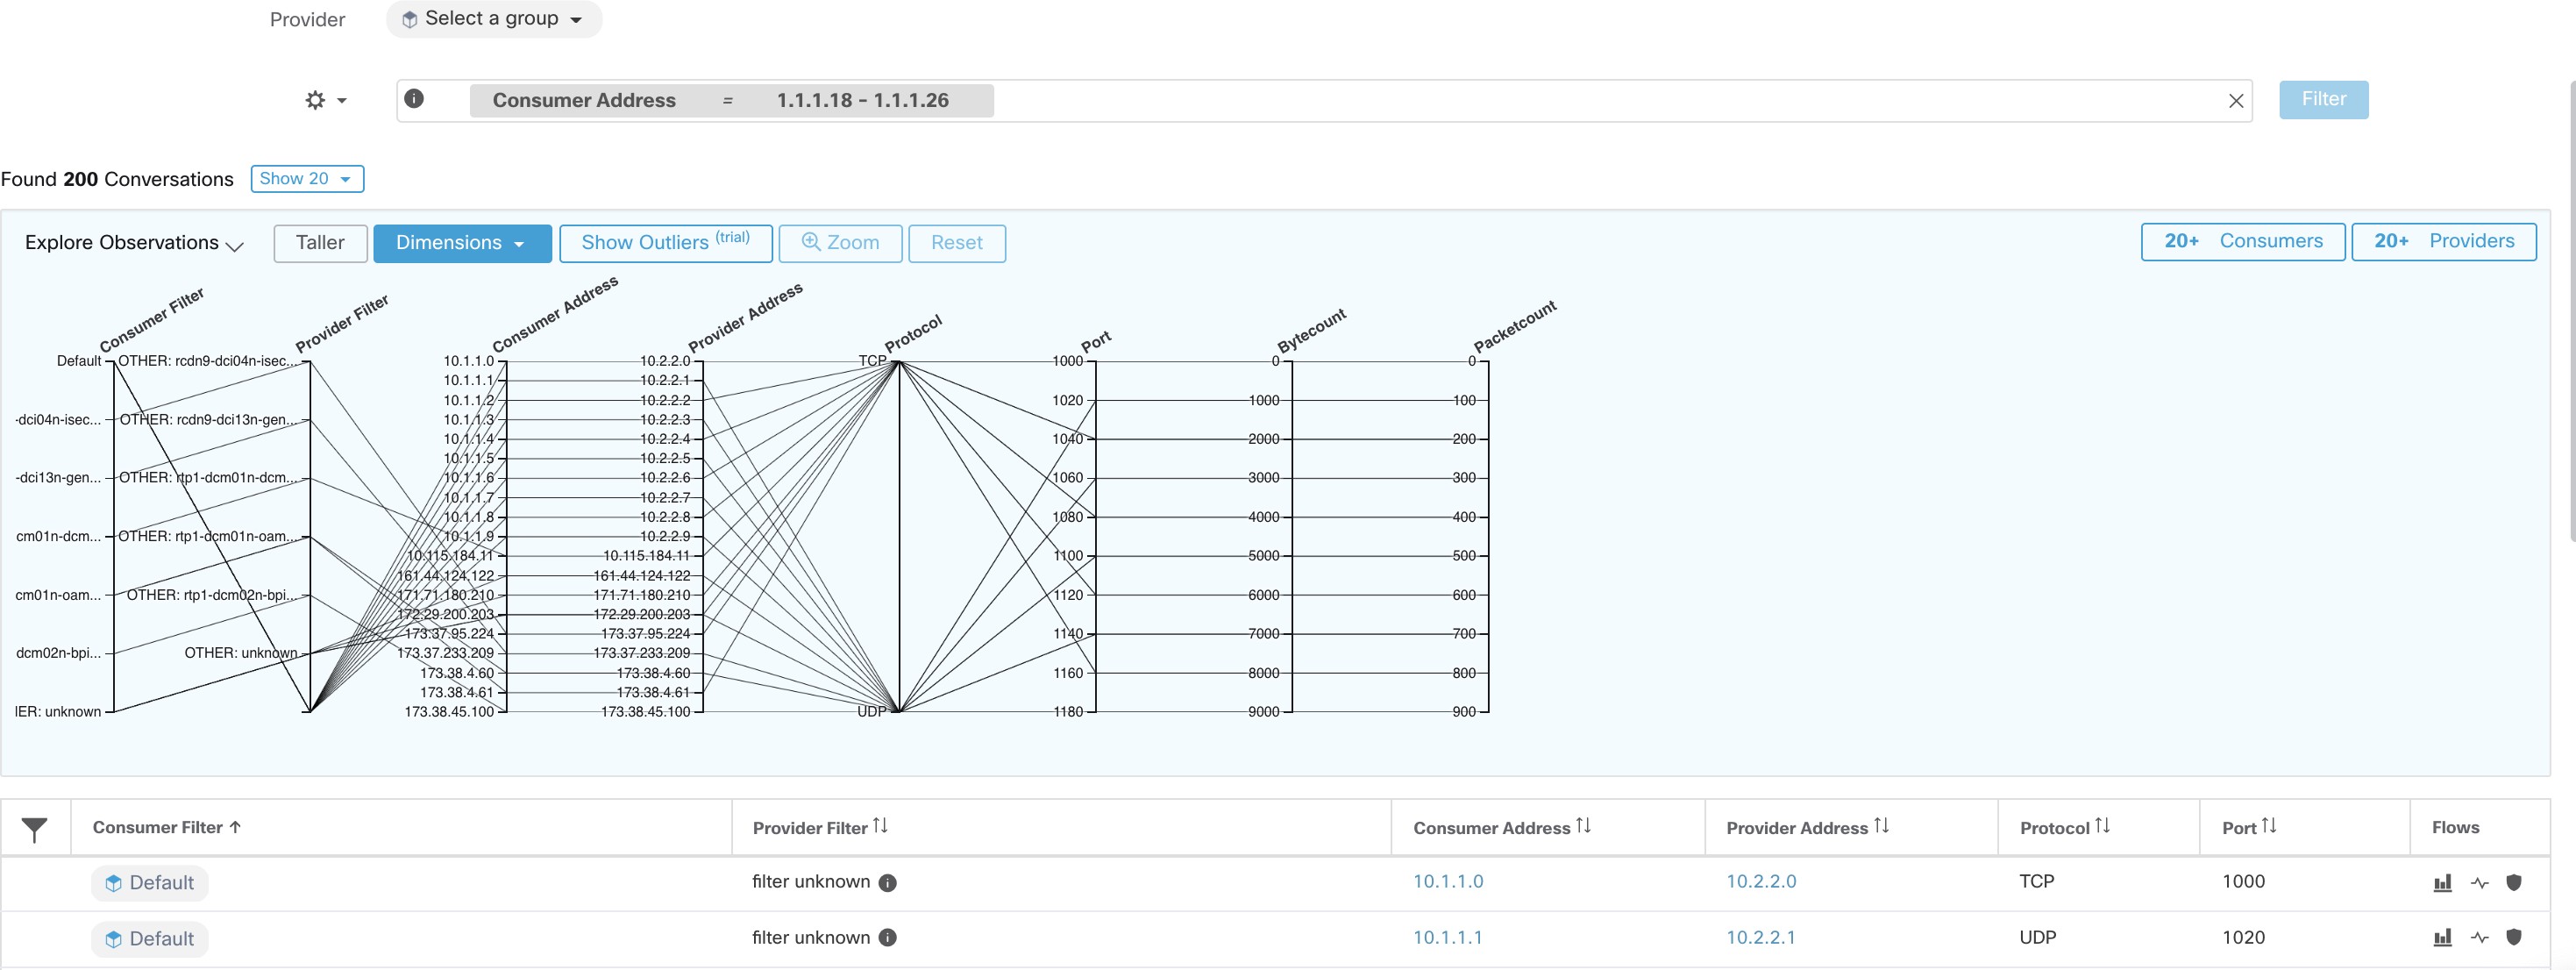
Explore Observations
Clicking on the Explore Observations button enables a chart view that allows quick exploration of the high-dimensional data via a “Parallel Coordinates” chart. A bit overwhelming at first, this chart can be useful when enabling only the dimensions you’re interested in (by unchecking items in the Dimensions dropdown), and when rearranging the order of the dimensions. A single line in this chart represents a single observation, and where that line intersects with the various axes indicates the value of that observation for that dimension. This can become clearer when hovering over the list of observations below the chart to see the highlighted line representing that observation in the chart: