Top N Charts
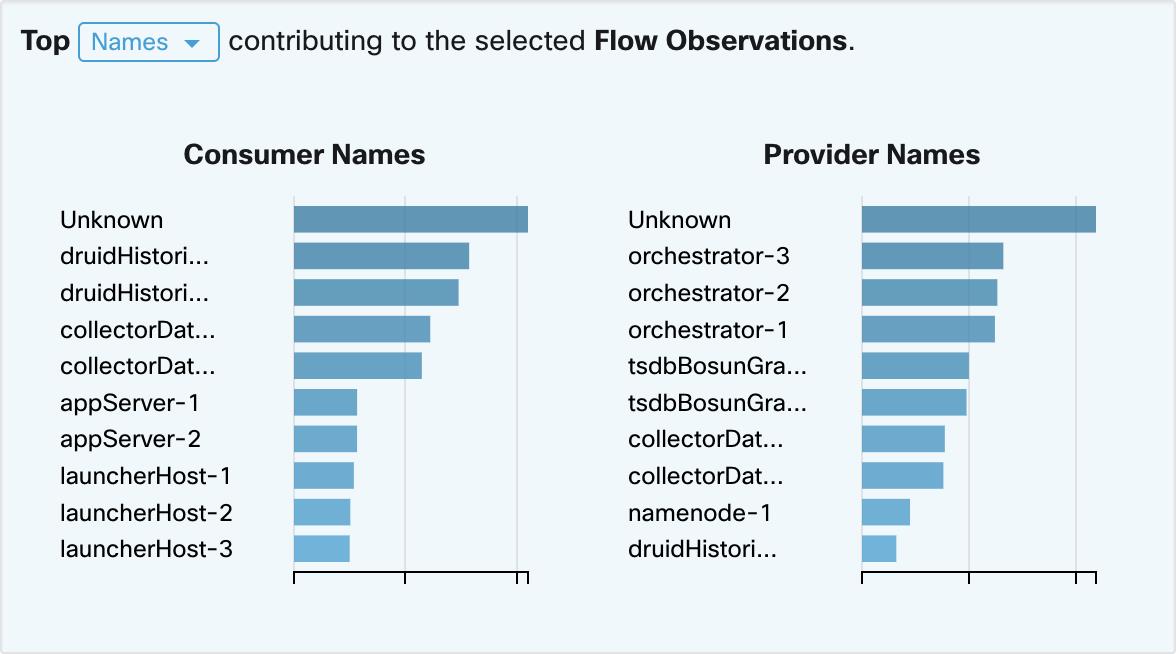
The charts display the Top N values that contribute to the selection in the Filtered Time series chart to the left. Selecting a peak in Flow Observations in the time series chart, and hostnames in the Top N charts, displays the list of hostnames (Consumer and Provider) that contribute the most to those flow observations. Also, if the time series chart is set to display SRTT, then the Top Hostnames display those that contribute most to that selected SRTT.
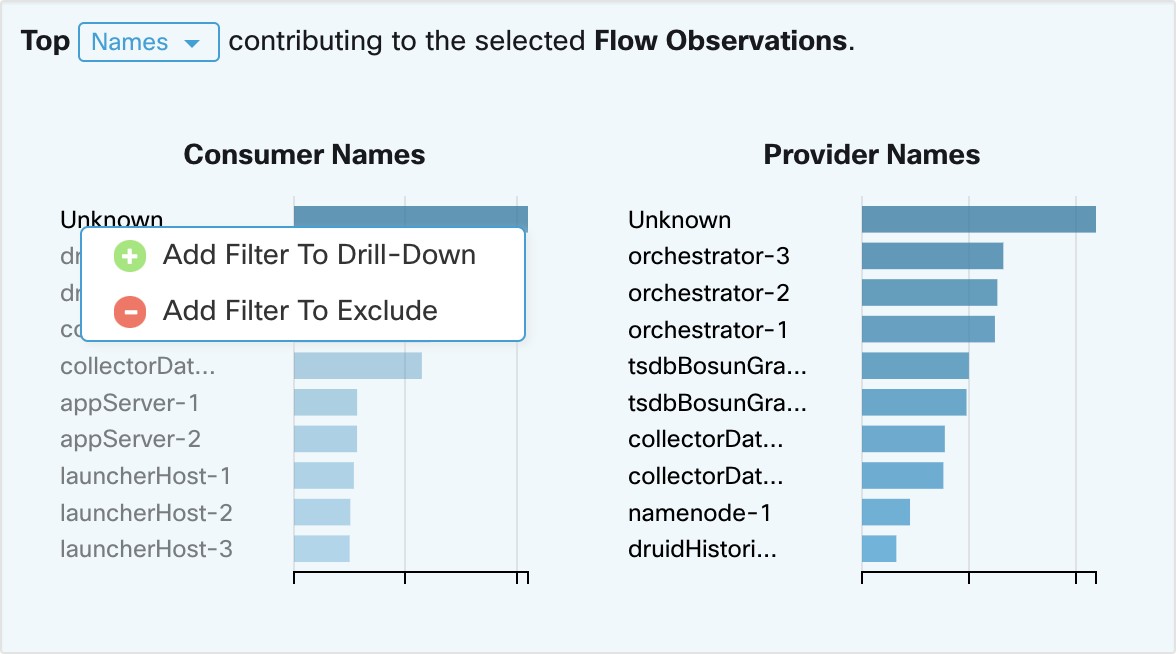
Click on any of the items in the Top N charts to display a menu that allows you to either Drill-Down or Exclude that value.
-
Click Drill-Down to add a filter that confines the results to just that value.
-
Click Exclude to add a filter that excludes that value from the results.
|
|
After clicking Drill-Down or Exclude, the Filter icon must be pressed for the filter to take effect. This is so that multiple Exclude actions can be taken quickly without having the page repeatedly update in the middle. |