Current Alerts
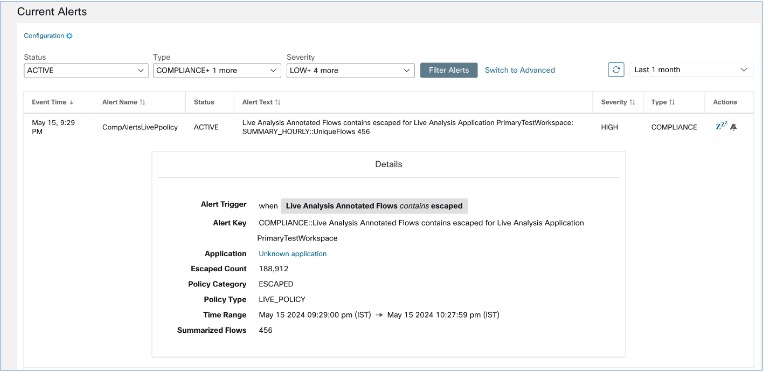
Navigate to the Investigate > Alerts page to view the list of all active alerts. You can filter the alerts by Status, Type, Severity, and Time Range.
Only alerts with severity set to IMMEDIATE_ACTION, CRITICAL, HIGH, MEDIUM, or LOW are displayed on the Current Alerts page. All alerts irrespective to the severity values are sent to the configured Kafka broker.
Filter Alerts by Time Range
-
Choose a range from the drop-down list. The default value is 1 month.
-
Click Custom and fill in the From and To dates to configure a custom range. Click Apply. Note that when a custom time range is selected, the Refresh button is disabled.
Advanced Filtering
-
Click Switch to Advanced.
-
Enter the attributes to filter. Hover over the info icon to view the properties to filter.
The alert filters are not retained when you switch back to the basic options.
View Additional Alert Details
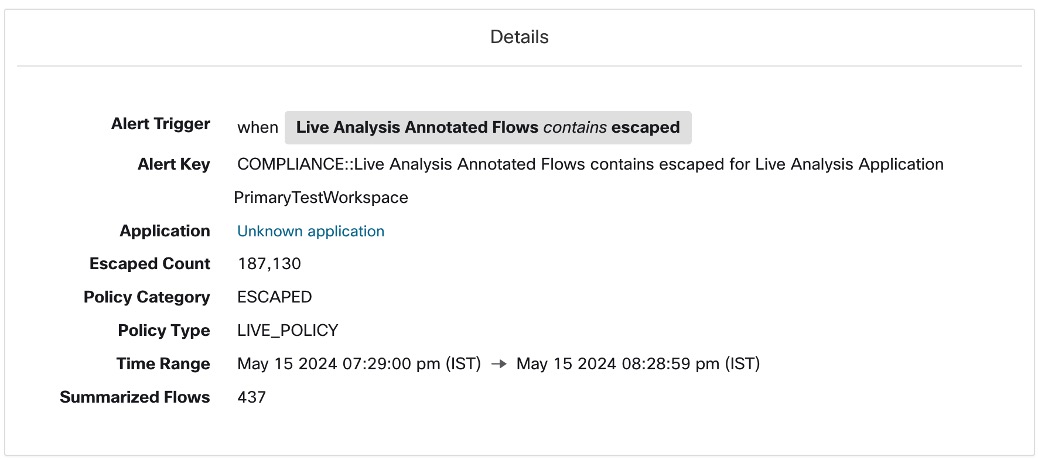
You can view more details about an alert by clicking the corresponding alert.
-
Only 60 alerts per minute per root scope are displayed.
-
A higher volume of alerts results in an alert type called Summary Alerts, with the count of alerts that are not displayed .
-
There is a maximum limit on the number of alerts that are displayed at any point in time; older alerts are dropped as new alerts come in.
For more information, see Limits.