Where to See Network Anomaly Events
|
|
Network Anomaly events are not currently shown on Forensics Analysis page. You can find Network Anomaly events on the following pages. |
-
Security Dashboard: Network Anomaly events that match rules with RECORD action can be found in the Network Anomaly score section in the Security Dashboard. If there are workloads with nonbest (less than 100) scores, clicking on the workload name, you are able to view the PCR time series and the Network Anomaly events on that workload. On the right side of each row of the Network Anomaly event table, you can see action links that can help you search for flows and other forensic events around the time of the corresponding Network Anomaly event. See Network Anomaly latency for known delay in Network Anomaly score reporting.

Figure 1: Network Anomaly Score in Security Dashboard 
Figure 2: Network Anomaly score in Security Dashboard Drilled-Down by Workload -
Workload Profile Page / Network Anomaly Tab: on this page, you can see the PCR time series graph and the Network Anomaly events that match rules with RECORD action. What you can see that on this page is similar to what you find by clicking on the workload name in the security dashboard.
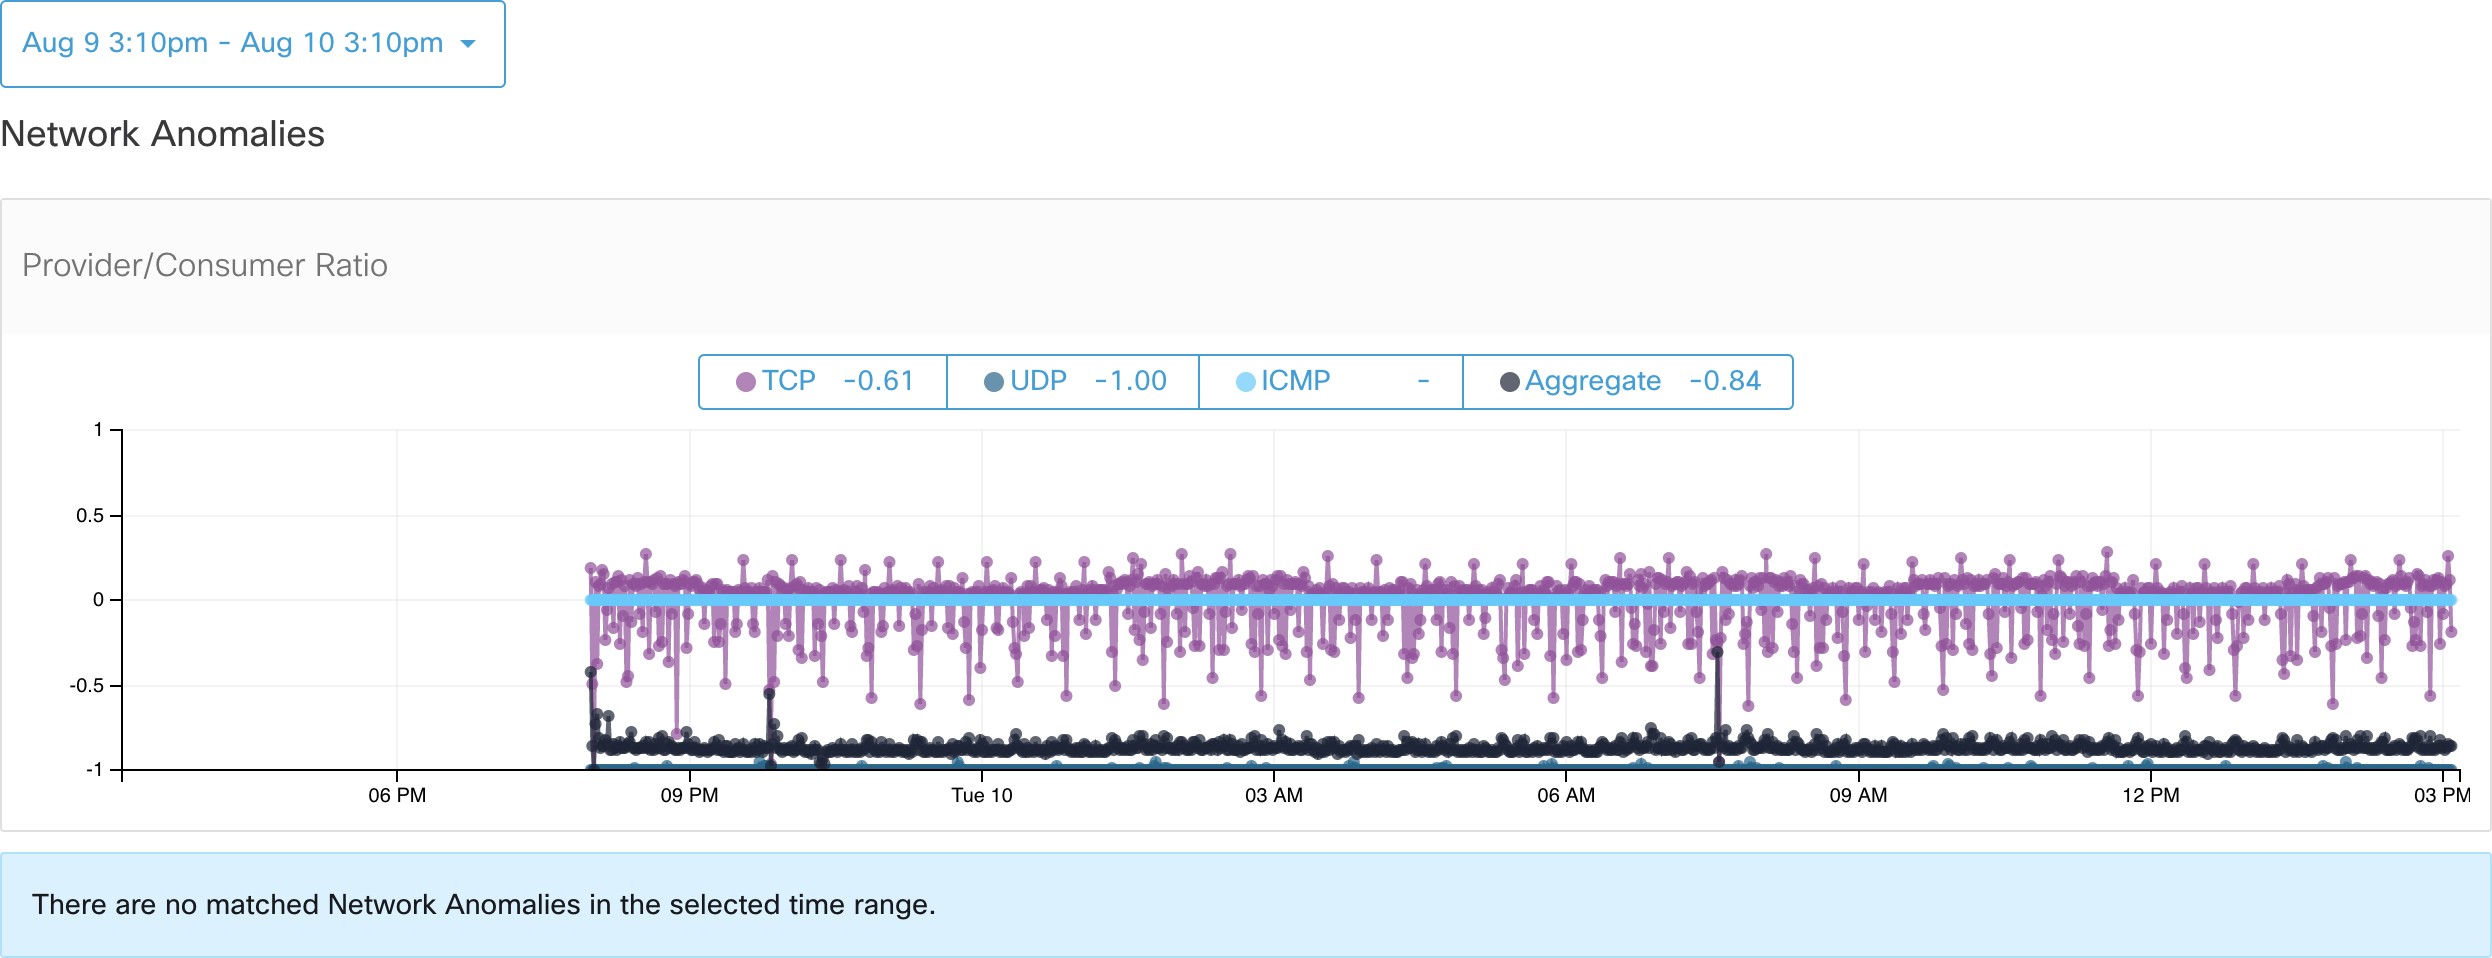
Figure 3: Network Anomaly Tab on Workload Profile Page -
Alerts: If the Network Anomaly rule is configured with ALERT action, the matched events is displayed on the Alerts Page and are also available via Alert Publisher.

Figure 4: Network Anomaly Alert


