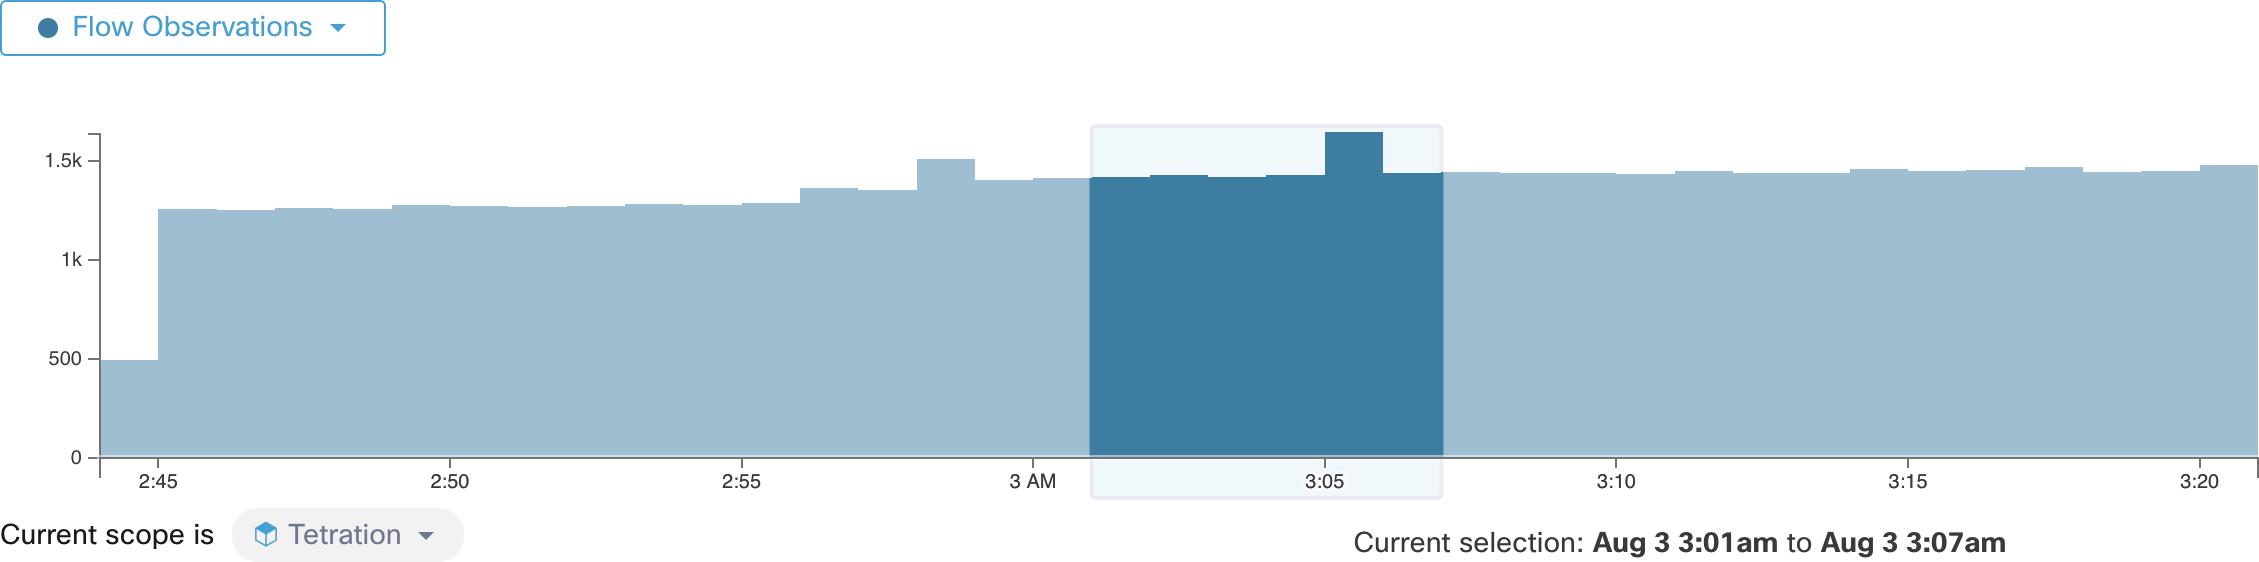
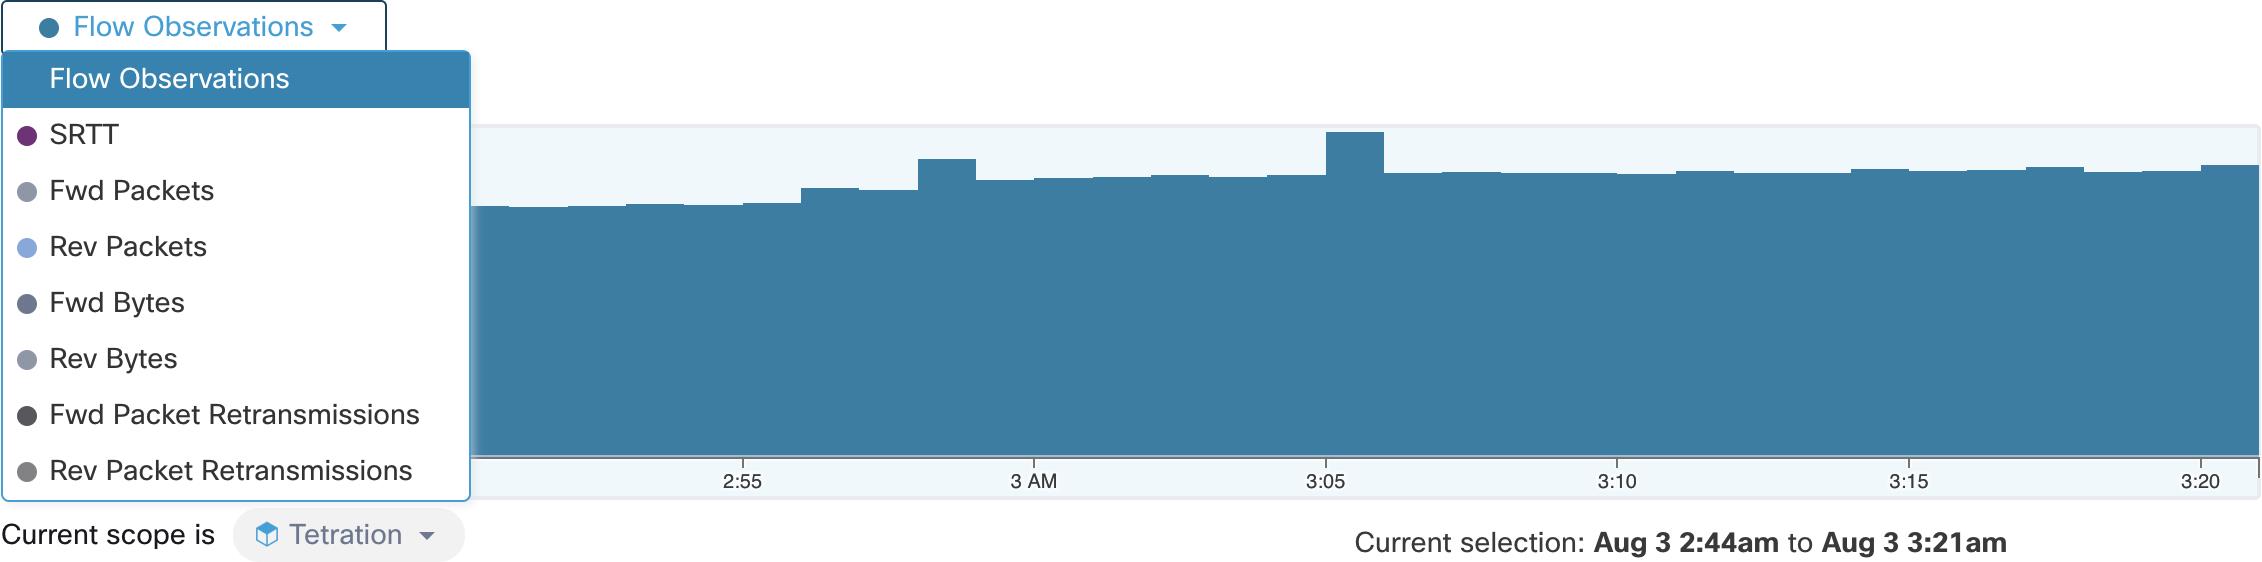
Filtered Time series
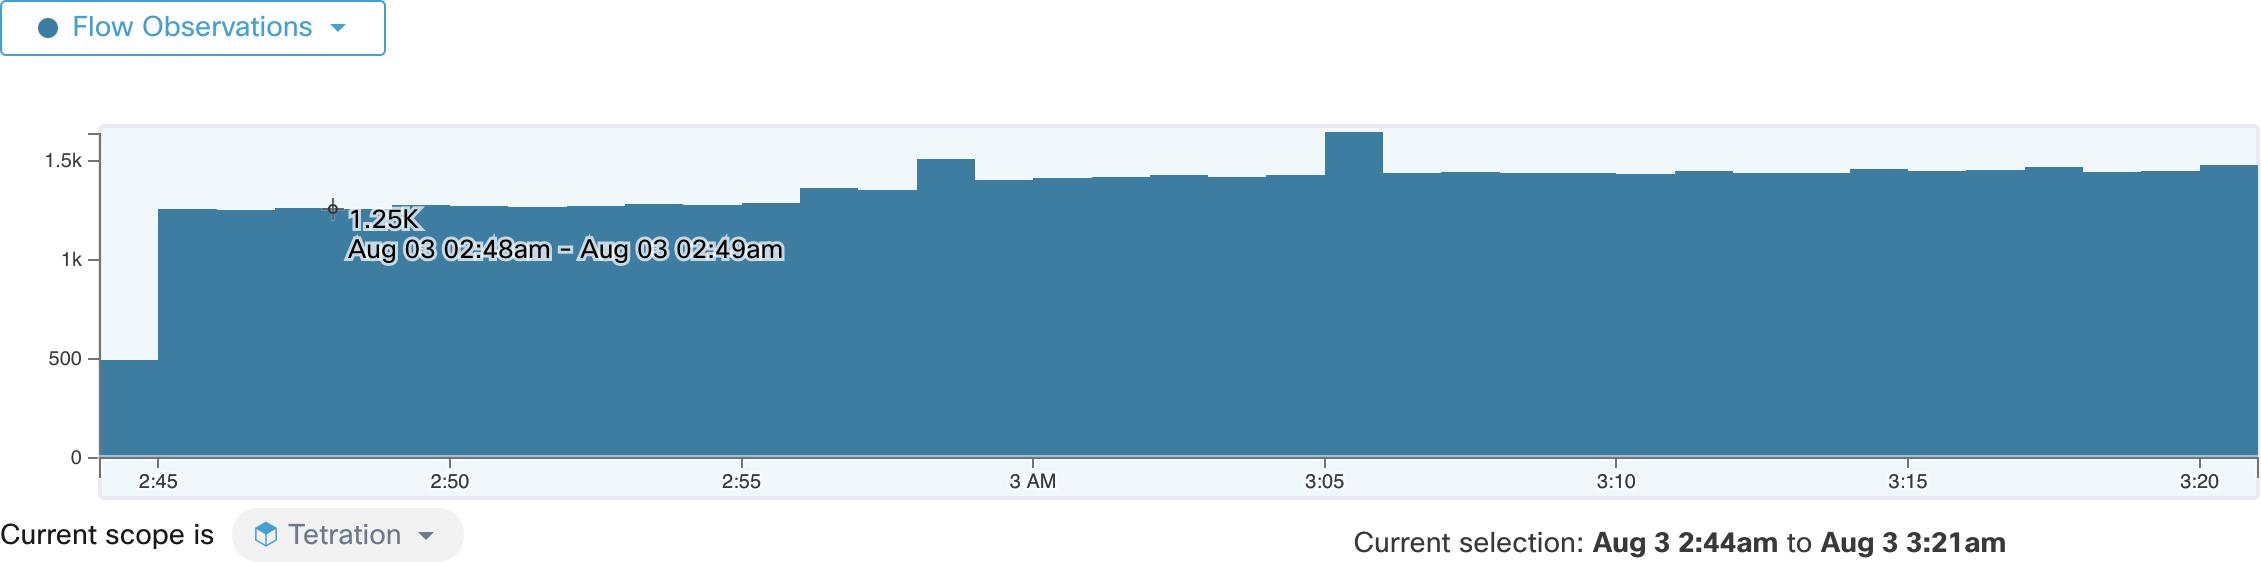
This component displays the aggregated totals of various metrics for the interval selected (the selection made in the above Corpus Selector). Use the dropdown to change which metric is displayed.
Further-narrowing of the selected interval can also be done in this component. Click the area of the chart that you’d like to focus on, and the Top N Charts and the data below will all be updated to include only data from that selected interval.