Service Dashboard
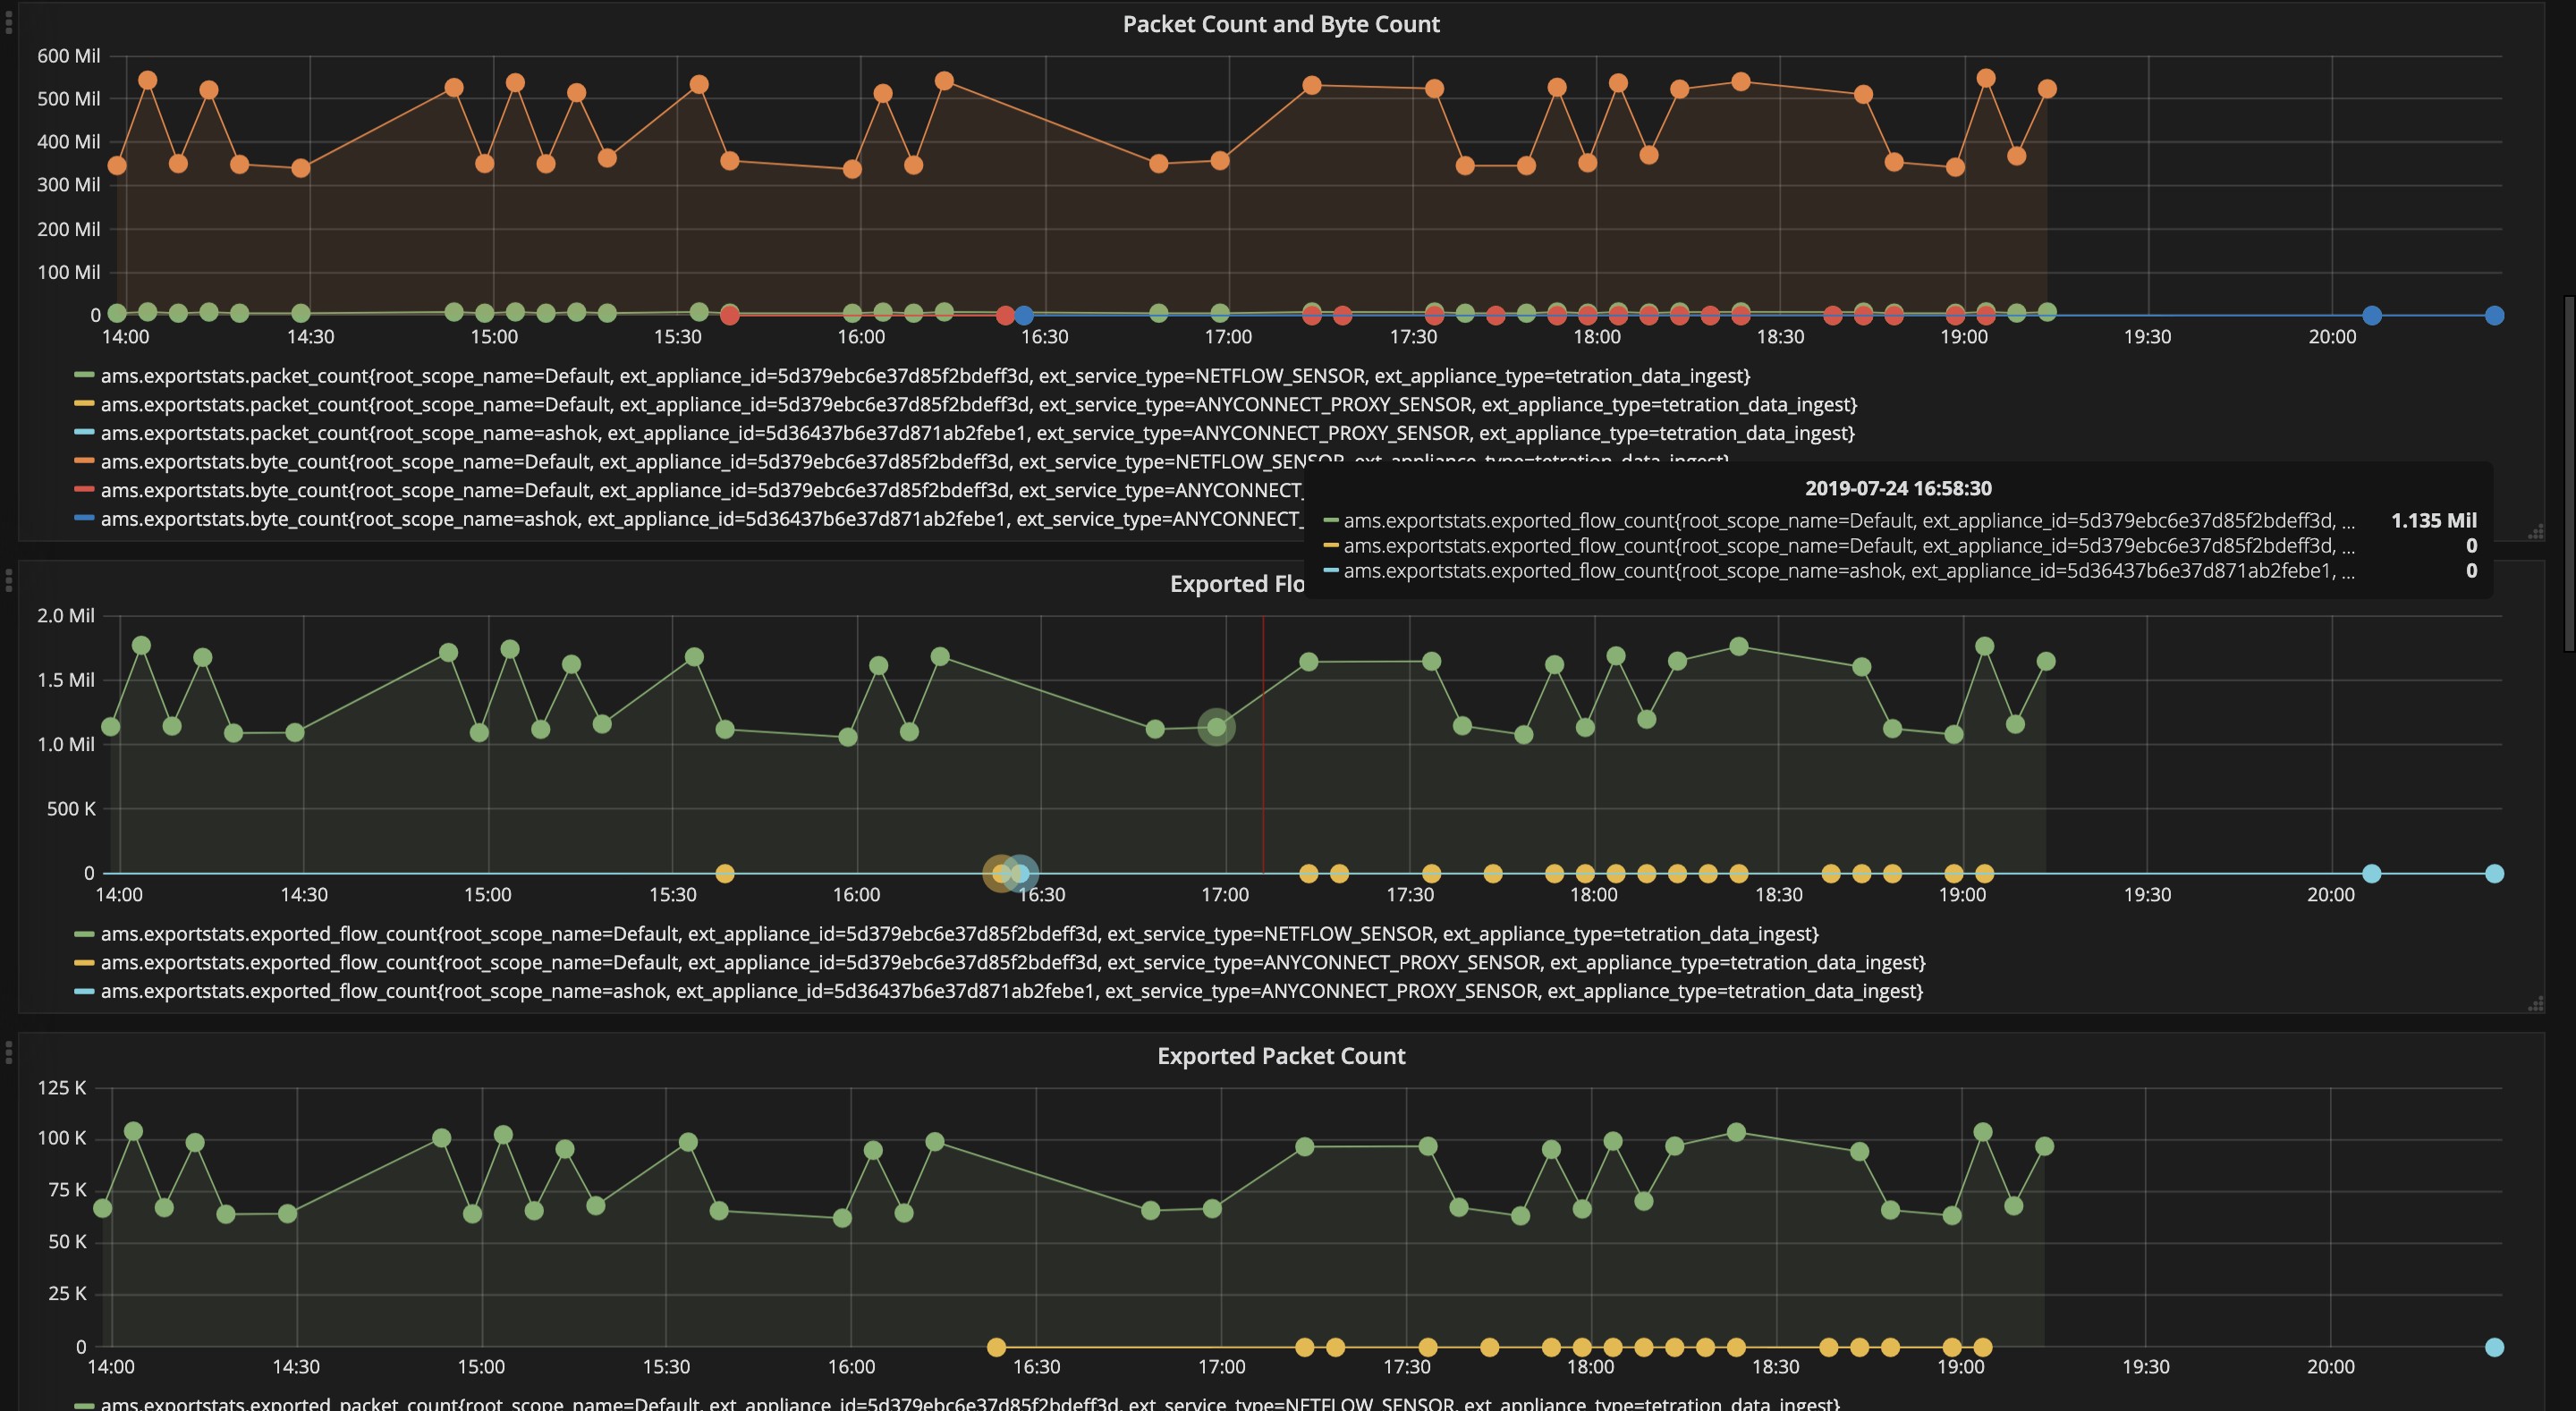
Service dashboard provides information about export metrics -if applicable- including number of flow observations exported to Secure Workload, number of packets exported to Secure Workload, and number of bytes exported to Secure Workload. In addition, this dashboard also provides information about protocol processing and decoding (for example, services that process NetFlow v9, and IPFIX). Metrics such as decoded count, decoded error count, flow count, packet count, and byte count are available in this dashboard. Furthermore, system metrics for the Docker container where the service is running are also included in this dashboard. Metrics such as CPU usage percentage, memory usage percentage, disk usage percentage, and number of open file descriptors are part of this dashboard.