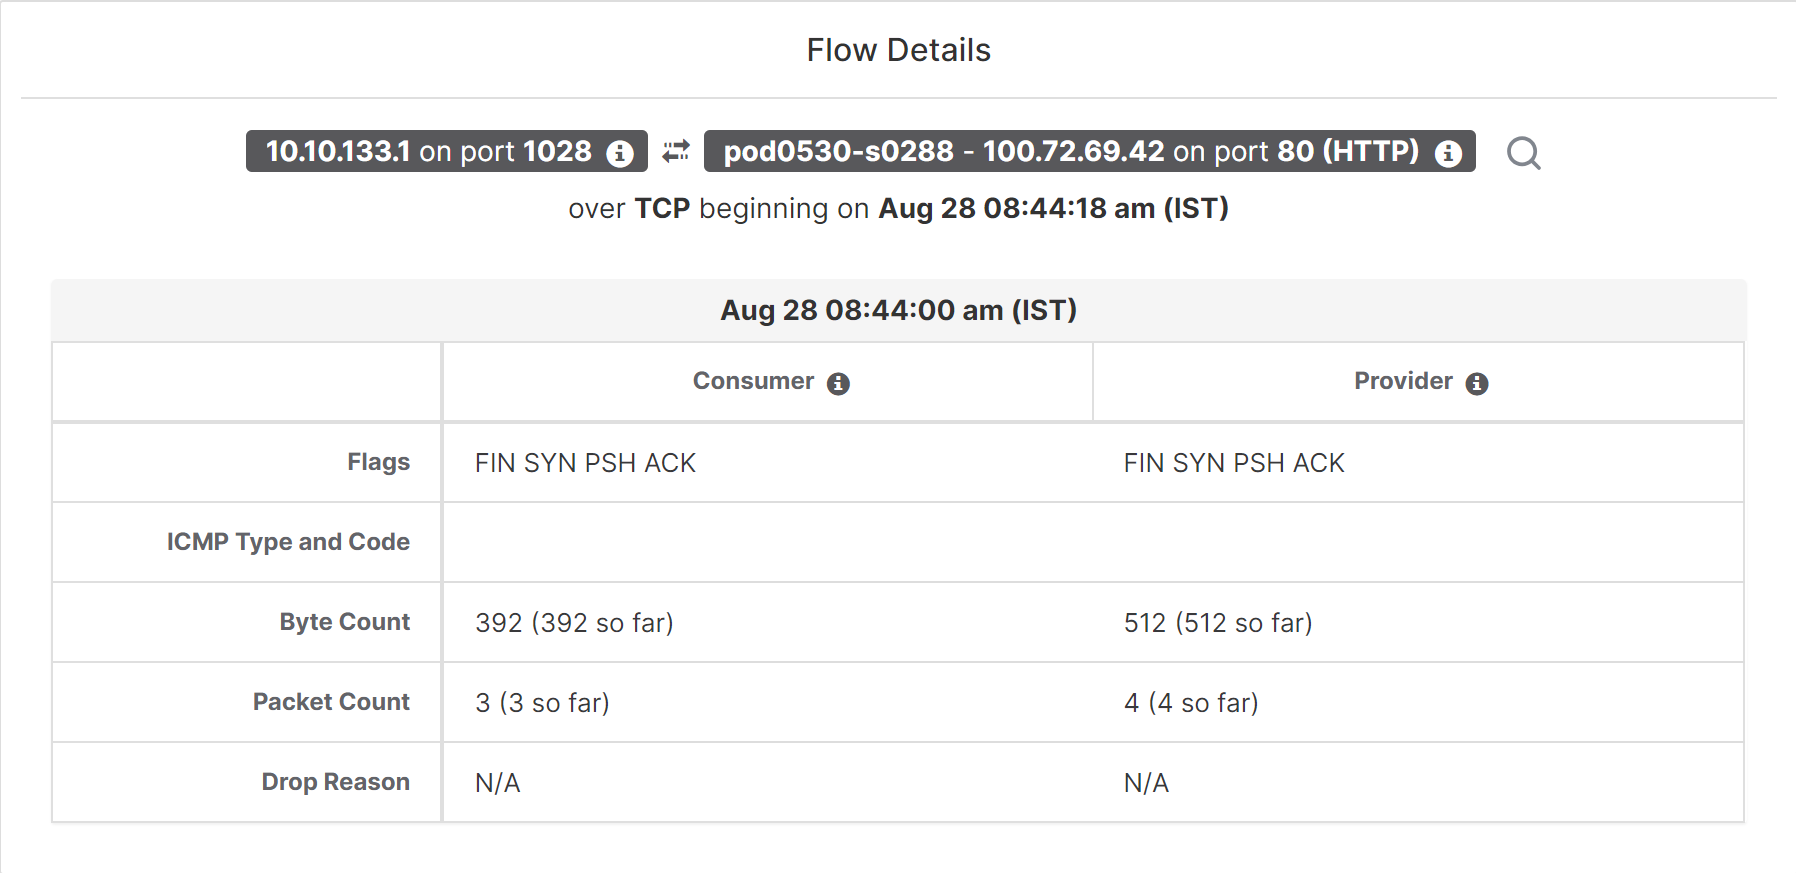
Flow Details
Click on any of the rows to expand the Flow Details section. This displays a summary of the flow and charts for various metrics for the lifetime of that flow. For long-lived flows, a summary chart is displayed at the bottom that allows you to choose different intervals for which to view time series data.
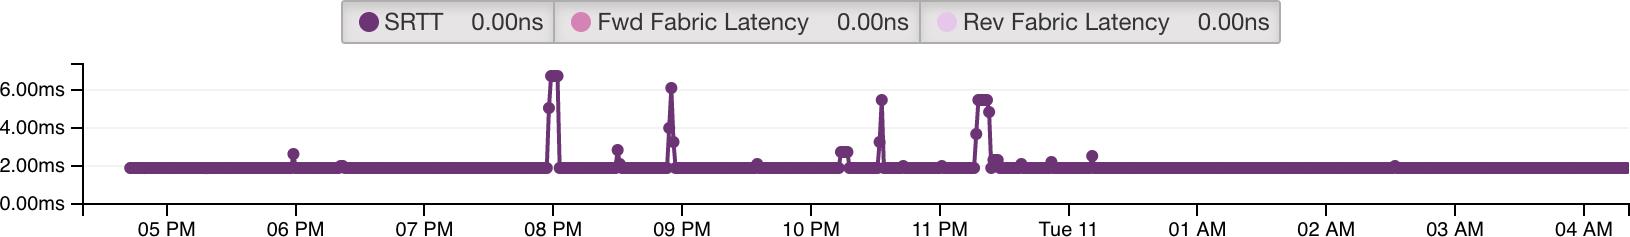
For flows labeled with Fabric Path information, Fwd/Rev Fabric Latency and SRTT are available. Time series charts for other metrics such as Fwd/Rev Burst Indicators and Fwd/Rev Burst+drop Indicators may be displayed if available. See Visibility Warning.