Explore Observations
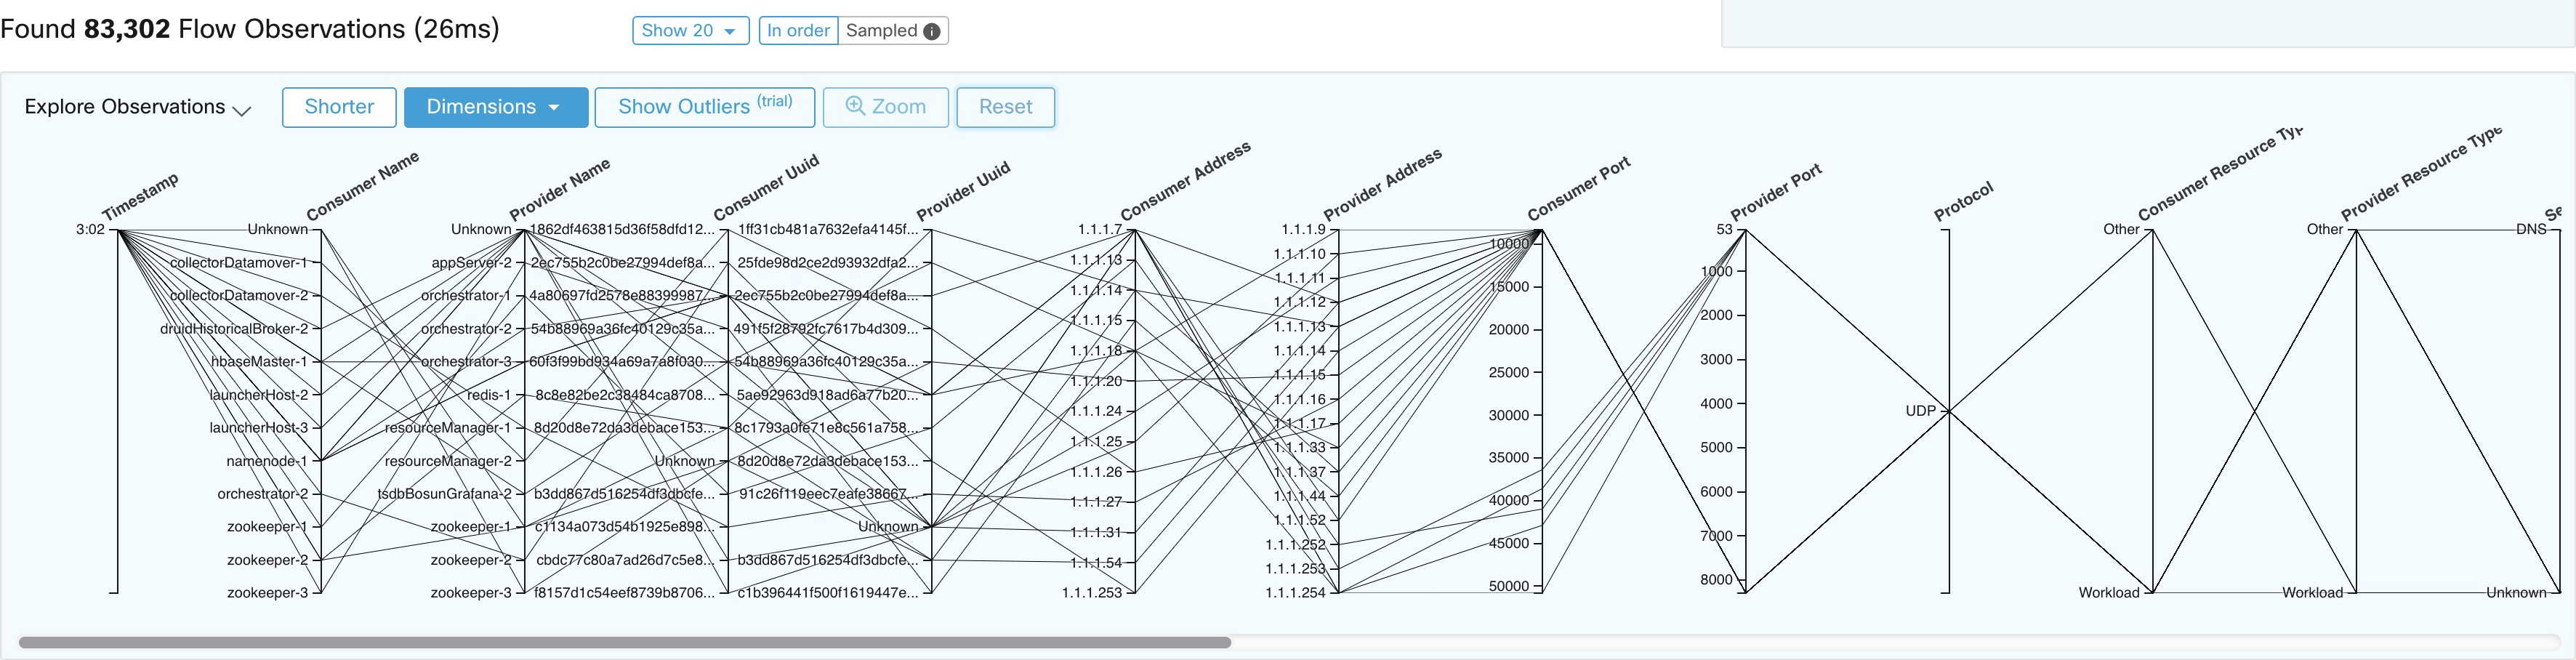
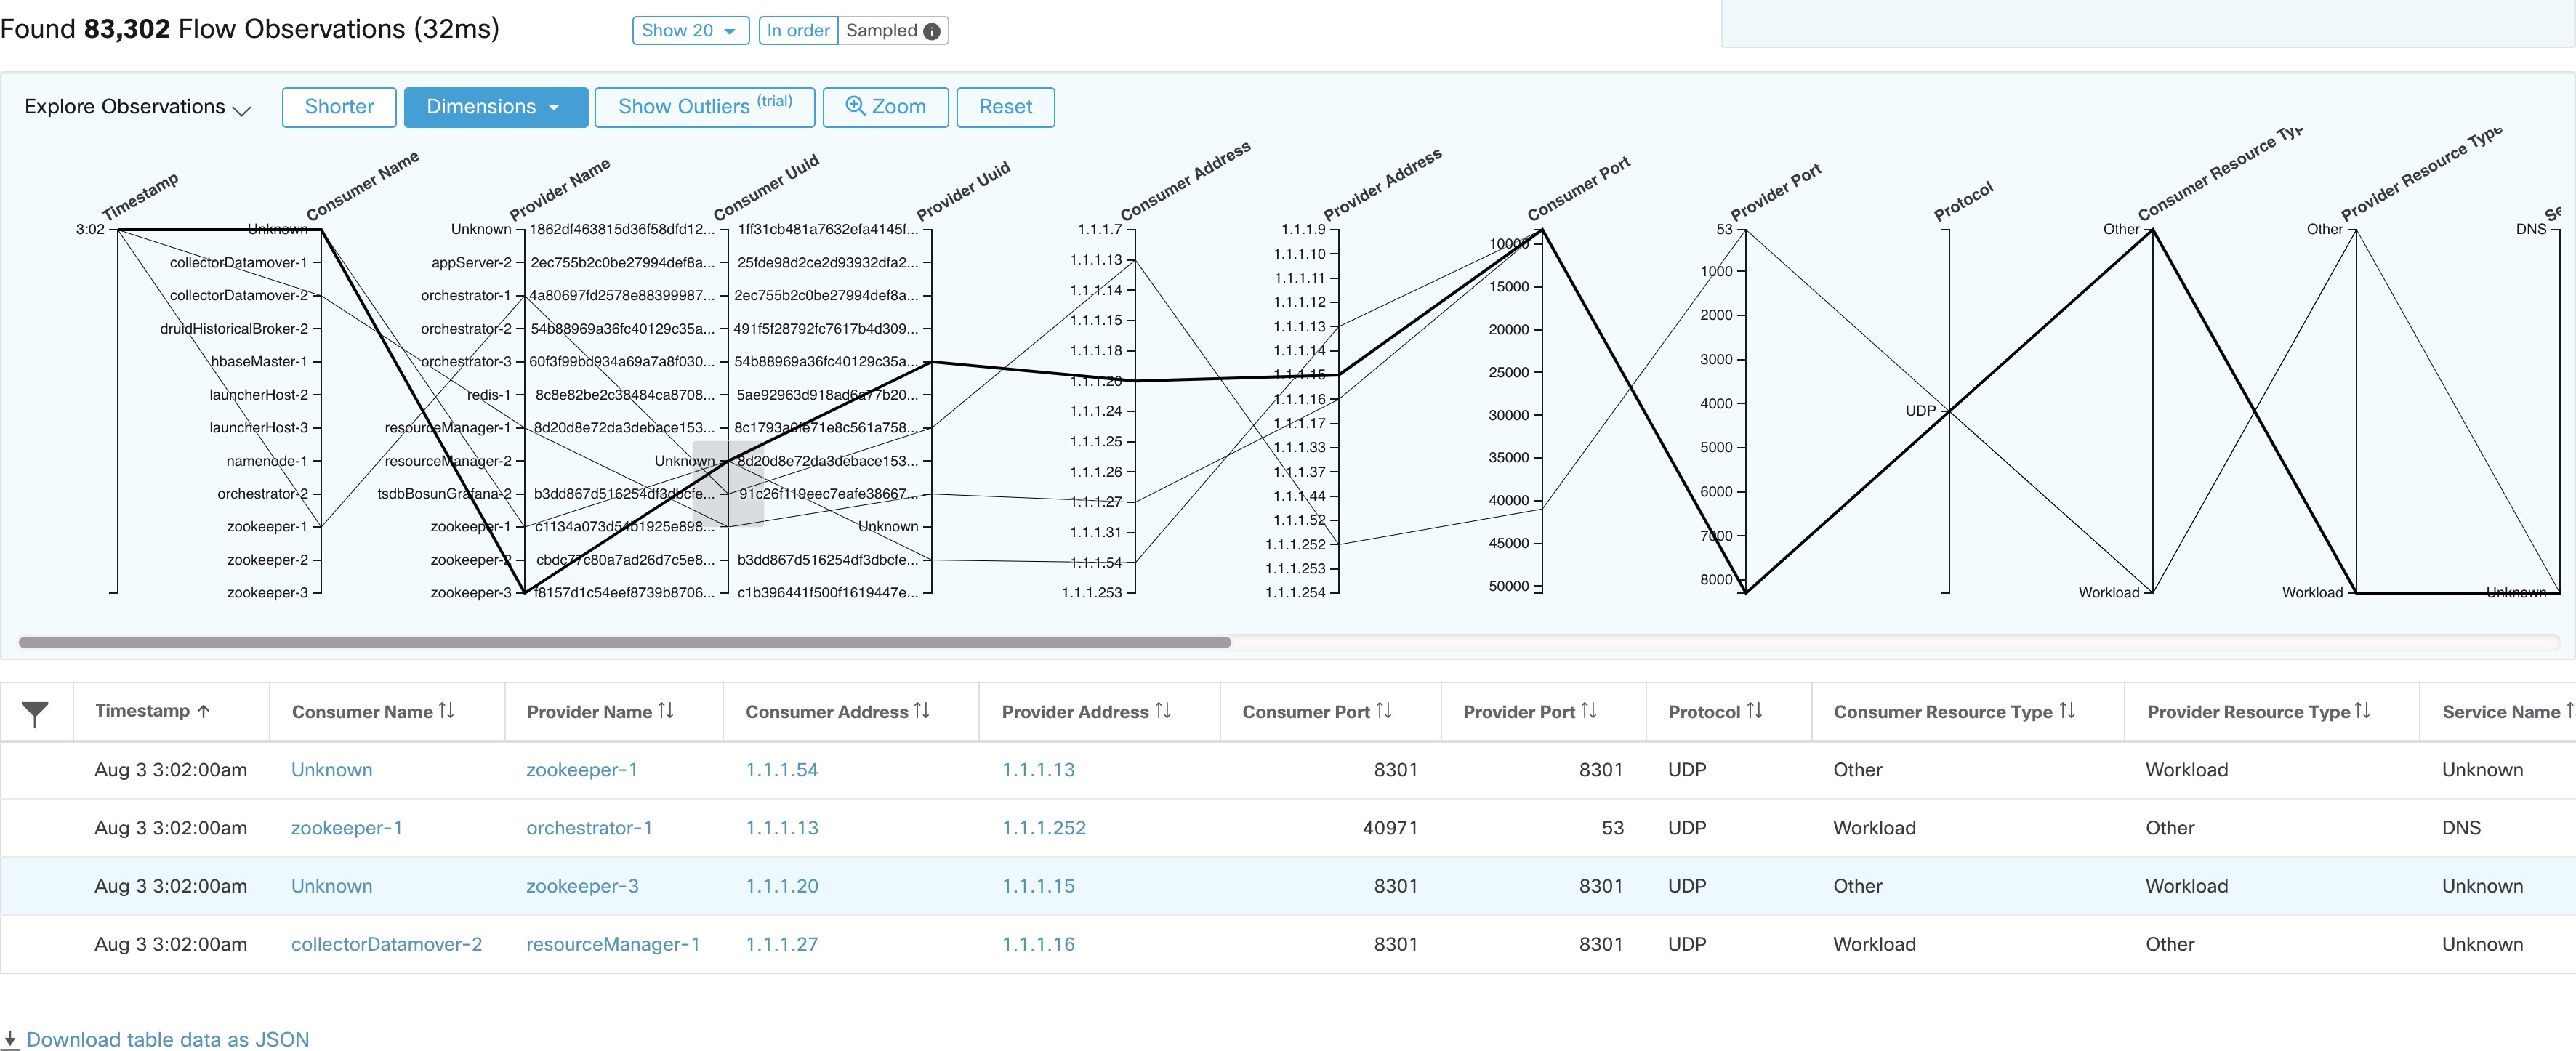
Click Explore Observations to enable a chart view that allows quick exploration of the high-dimensional data (Parallel Coordinates chart). A bit overwhelming at first, this chart is useful when enabling only the dimensions you’re interested in (by unchecking items in the Dimensions dropdown), and when rearranging the order of the dimensions. A single line in this chart represents a single observation, and where that line intersects with the various axes indicates the value of that observation for that dimension. This can become clearer when hovering over the list of observations below the chart to see the highlighted line representing that observation in the chart:
Due to the high-dimensional nature of the flow data, this chart is wide by default, and requires scrolling to the right to see the entire chart. For this reason, it’s useful to disable all but the dimensions you’re interested in.
Sampling vs. In-Order
It’s recommended that Explore Observations be done with sampling enabled, and with a larger number of flows. This allows you to see more of the variety of flows that comprise the selected interval. So, if you’ve selected 2 million flow observations in the time series chart above, loading a sample of 1000 will take uniformly from throughout the interval, whereas loading flows In-order will load the first 1000 flow observations from the very beginning of the interval:
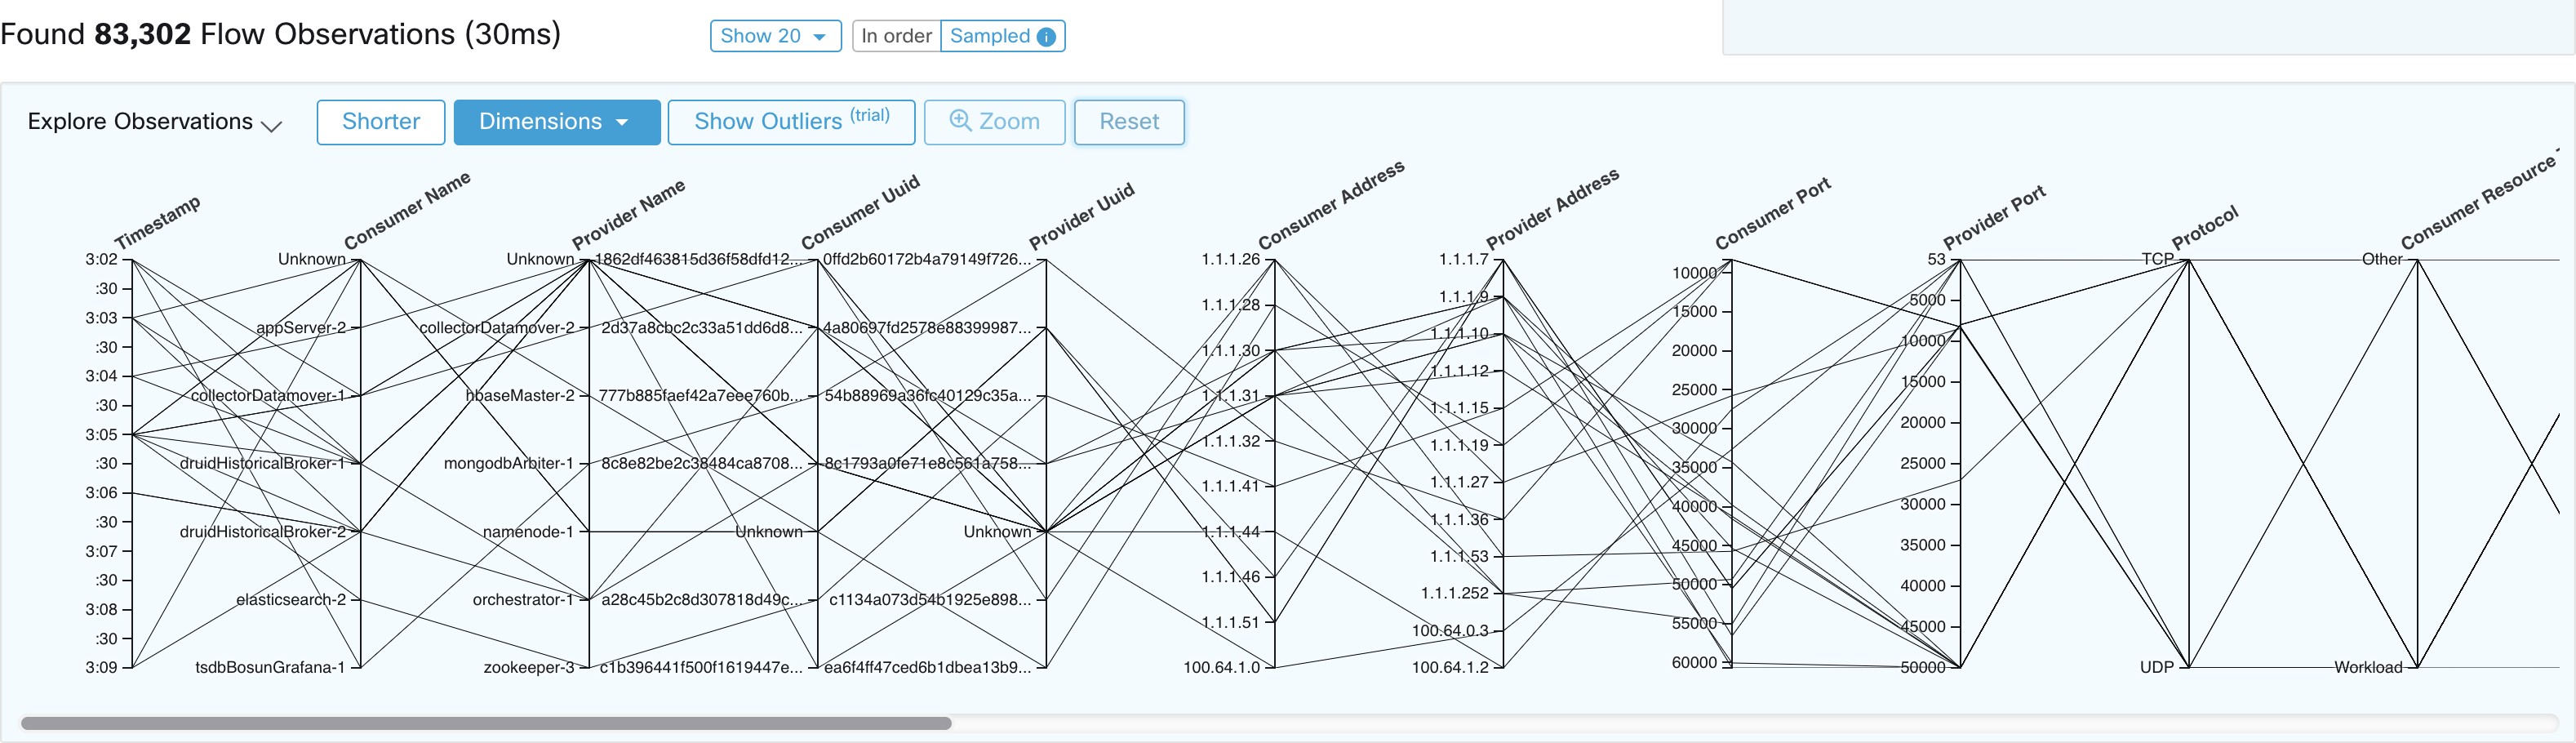
Notice how the Timestamp for all of the in-order observations is from 9:09 and how the observations are evenly distributed through the selected interval in the sampled version.
Filtering
Dragging the cursor along any of the axes create a selection that shows only observations that match that selection. Click again on the axis to remove the selection at any time. Selections can be made on any number of axes at a time. The list of observations updates to show only the selected observations: